Richard Charnin
June 18, 2016

Matrix of Deceit: Forcing Pre-election and Exit Polls to Match Fraudulent Vote Counts
Proving Election Fraud: Phantom Voters, Uncounted Votes and the National Exit Poll
LINKS TO POSTS
Democratic Primaries spread sheet
Recommended reading: election fraud-Nina Illingworth
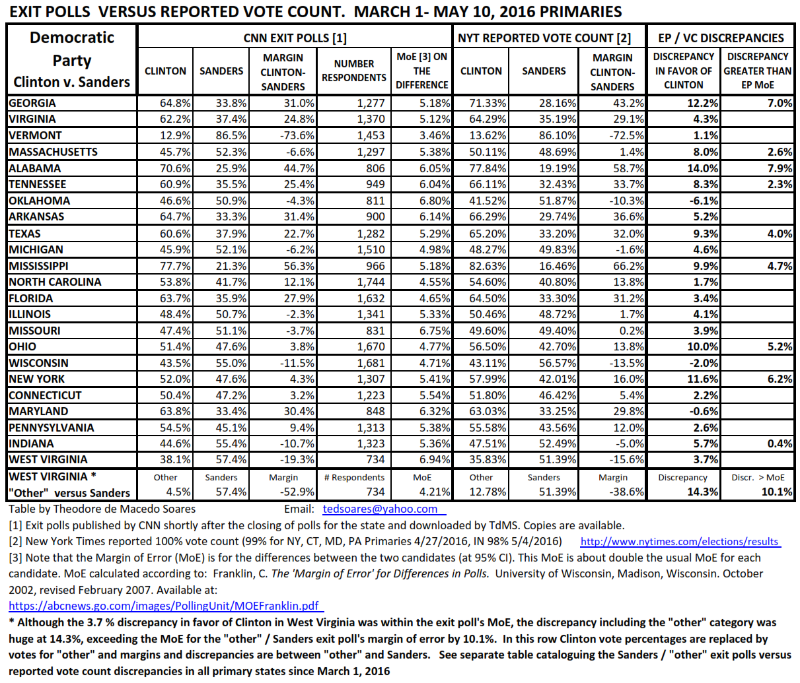
Democratic primary exit polls were adjusted to match the recorded vote to within 0.06%. This confirms what we already know: Unadjusted exit polls are always forced to match the recorded vote. The premise is that there is ZERO fraud in every election polled. View the adjusted polls: http://www.cnn.com/election/primaries/polls
Adjusted Exit Poll discrepancies from the recorded vote
The Gender crosstab is the basis for calculating adjusted vote shares. Exit poll naysayers proclaim that the exit polls are not designed to forecast a winner. But the pollsters ask males and females who they just voted for. Isn’t that the same thing as forecasting the winner?
View the calculations to determine the discrepancies in this spreadsheet: https://docs.google.com/spreadsheets/d/1sGxtIofohrj3POpwq-85Id2_fYKgvgoWbPZacZw0XlY/edit#gid=1591963017
The average of the adjusted exit poll discrepancies from the recorded vote is virtually zero – a perfect match. The average margin of error is 3.5% for the 26 unadjusted polls.
| Source:CNN | Clinton | Sanders | Other |
| Average | 0.06% | -0.19% | 0.20% |
| CT | -1.48% | 0.06% | 1.42% |
| MD | -2.57% | -1.21% | 3.78% |
| PA | -0.50% | -0.50% | 1.00% |
| IN | -0.38% | 0.38% | |
| AL | -0.64% | 0.61% | 0.03% |
| AR | 2.91% | -0.72% | -2.19% |
| FL | 0.04% | -0.76% | 0.72% |
| GA | 0.87% | -1.36% | 0.49% |
| IL | -0.06% | -0.04% | 0.10% |
| IN | -0.38% | 0.38% | |
| MA | 0.75% | -0.39% | -0.36% |
| MI | -0.42% | -0.33% | 0.75% |
| MO | -0.10% | 0.00% | 0.10% |
| MS | 0.21% | -0.02% | -0.19% |
| NC | 0.20% | 0.40% | -0.60% |
| NH | 0.60% | 0.00% | -0.60% |
| NY | -0.32% | 0.32% | |
| OH | -0.10% | 0.50% | -0.40% |
| OK | -0.42% | 0.59% | -0.17% |
| SC | 1.21% | -0.71% | |
| TN | 1.37% | -0.91% | -0.46% |
| TX | 1.02% | -1.00% | -0.02% |
| VA | 0.12% | -0.03% | -0.09% |
| VT | -0.06% | 0.34% | |
| WI | -0.13% | -0.55% | 0.68% |
| WV | -0.24% | 0.02% | 0.22% |

Robin Greene
June 19, 2016 at 12:39 pm
How can we do something about this?
Who do I contact to get thsi investigated?
Cindy
June 19, 2016 at 12:45 pm
Yep, you don’t have to be a mathematician to find that too good a match to be true! Apply common sense everyone! Allow the scales to fall from your eyes!
Thank you Richard… keep these valuable insights/analyses coming 🙂
nothomesoon
June 19, 2016 at 1:13 pm
Richard you need to start this page by educating citizen’s on the history of exit polls and why they are such a reliable indication of voter fraud.
cindynsg
June 19, 2016 at 3:03 pm
Thank you for your continued work on this election. I realize that even I don’t understand the full extent of your work, but do know that YOUR work will contribute greatly towards making our election process a much fairer experience. You are the replacement for MSM. Your are greatly appreciated 🙂
Paul G
June 22, 2016 at 6:34 pm
Ok, so I am new to this idea of election fraud. I have definitely come to the very minor conclusion that our elections are not treated with care or protection. Its clear that there are so many asinine rules for determining who votes and that process takes precedence over the physical voters! I would assume that the breadth of problems can not all be attributed to incompetence. But when it comes to the larger and more sinister aspect of hacking and electronic manipulation, lying about the counts and results etc, I do have healthy skepticism, but I do believe it is possible.
So, lets get the math part out of the way, I completely agree that if the numbers you and others are using, something is terribly wrong, I understand that these probabilities are absurd, that’s only doubted by some very uneducated people. Therefore, it all boils down to, from my perspective, whether or not the ‘un-adjusted’ numbers are real, can be used (were conducted correctly & statistically significant), etc. So could you please explain in more detail how you found the un-adjusted numbers, why you think they are more reliable, and perhaps the sources, because I have found it hard to verify what the un-adjusted numbers are. There is much mis-information and confused information out there, that its difficult to decide what is fact. This aspect of your argument seems crucial to validating the fraud theory. Thank you for your work and hopefully your response.
Richard Charnin
June 22, 2016 at 8:03 pm
2016 Democratic primaries
https://i1.wp.com/tdmsresearch.com/wp-content/uploads/2016/06/Democratic-Party-Table.-2016-Primaries-1.jpg?zoom=2
!988-2008 unadjusted state and national exit polls
https://docs.google.com/spreadsheets/d/1EWaKPDUolqbN7_od8sSTNMRObfUidlVPRBxeyyirbLM/edit#gid=15
Paul G
June 23, 2016 at 11:54 am
Sir, thank you for responding. However, I was hoping for more than a screenshot. Im asking about methodology, scale, and accuracy, i.e. how the data is gathered. I read through the discussion on the Joshua Holland article and one point that came up but was never answered effectively regarded:
When the polls are adjusted? Holland used the term ‘preliminary data’ to describe the numbers that you and Jonathan Simon use. The discussion mentioned, as both men agreed that the results are weighted, but the agreement and discussion was cut off when it reached what happens after. Basically whether the data is forced to match recorded vote results? If there is fraud, the understanding and nature of this process is essential in proving it.
Richard Charnin
June 23, 2016 at 11:18 pm
Unadjusted exit poll data is always forced to match the recorded vote.
Exit polls are adjusted up until closing of the precinct voting.
So the unadjusted polls have actually been adjusted during the day.
In the FINAL ADJUSTMENT (perhaps a few hours after precinct voting is ended) the exit poll is forced to EXACTLY match the recorded vote.
Here is the proof:
Now would you please read the notes at the bottom of the table?
Read this: http://www.aapor.org/Education-Resources/Election-Polling-Resources/Explaining-Exit-Polls.aspx
If you have more questions, you will have to do your own research.
Do you know how to google?
Richard Charnin
June 23, 2016 at 6:27 pm
I gave you everything you wanted to know. That’s it.
I will not spend any more time discussing this.
I have work to do. So do you. Do your homework.