Conspiracy Theories and Mathematical Probabilities
Richard Charnin
May 25, 2012
Updated: Dec.8, 2015
Look inside the books:
– Reclaiming Science:The JFK Conspiracy
– Matrix of Deceit: Forcing Pre-election and Exit Polls to Match Fraudulent Vote Counts
– Proving Election Fraud
It’s an interesting exercise to calculate mathematical probabilities of so-called “conspiracy theories”. The mainstream media and their cadre of online gatekeepers and trolls use the term “Conspiracy Theorist” (CT) as a derogatory label for those who seek the truth. According to these disinformationists, there is no proof of conspiracies.
But they avoid factual analysis based on the scientific evidence and can’t refute the mathematics that proves beyond a reasonable doubt that there is a massive conspiracy to hide the truth of these events from the public.
Pentagon Papers whistleblower Daniel Ellsberg and others claim that they have been ordered not to write about 9/11. This has not been reported by the corporate media, proving their point.
A pathetic article by world-class coincidence theorist and disinformationist Michael Shermer appeared in Scientific American. Who would expect a respected magazine to print this? Check out the comments from readers. Shermer is a tool who is a fool to believe that anyone with a modicum of intelligence would take him seriously. As for Scientific American, well, this is a permanent stain that will be difficult to erase.
These myths are promoted non-stop in the mainstream media.
– Oswald acted alone in 1963 – with a magic bullet and defective rifle.
– Bush won Florida in 2000 and had a 3 million “mandate” in 2004.
– Nineteen Muslims armed with box cutters who could not fly a Cessna, hijacked four airliners and outfoxed the entire U.S. defense establishment while Bin Laden was on dialysis, near death and hiding in caves.
Scientific notation is necessary to express the extremely low probabilities of the following events. For example, the probability P that at least 23 material witnesses would die unnaturally in the year following the JFK assassination is 7.3E-40 in scientific notation (less than 1 in a trillion trillion trillion).
To put the numbers in context: There are an estimated 300 billion trillion (3E23) stars in the universe. That’s 3 followed by 23 zeros: 300,000,000,000,000,000,000,000. There are an estimated 700 thousand trillion (7E17) grains of sand on earth or 7 followed by 17 zeros: 700,000,000,000,000,000.
The probability calculations are based on the Normal, Binomial and Poisson distribution functions.
The Normal Distribution (ND) is based on a sample of observations defined by the mean (average) value and standard deviation (a measure of volatility of the observations from the mean). The ND is used to calculate the probability that Kerry’s unadjusted 51.7% National Exit Poll (13660 respondents) share would deviate 3.4% from his 48.3% recorded national share.
The Binomial Distribution (BD) is used to calculate the probability P of n successes in N trials when the probability p of a success is constant in each trial. The BD is used to calculate the probability P that n= 86 of N=88 DRE voting machines would flip votes from Kerry to Bush.
The Poisson Distribution (PD) is used to calculate the probability P that a given number n of events with low probability will occur over a period of time. The PD is used to calculate the probability P that at least n=78 JFK-related individuals out of a population of N=1400 witnesses would die unnaturally in the T=15 years following the assassination.
Executive action: JFK witness-deaths Probability analysis
The probability analysis is straightforward; it’s not a theoretical exercise. It is a mathematical proof of a conspiracy based on factual data: number of witnesses, number of unnatural (murder, accident, suicide, unknown) deaths, corresponding mortality rates and the time period. The Poisson function calculates the probability. The average U.S. 1964-78 unnatural mortality rate was 0.000818. The average JFK witness mortality rate (0.000247) was lower due to the high proportion of homicides compared to suicides and accidents.
In the 1973 film Executive Action it was revealed that an actuary hired by the London Sunday Times calculated the probability that 18 material witnesses would die within three years of the assassination as 100,000 trillion to one.
This is a challenge to those who still claim that the deaths do not prove a conspiracy: To substantiate your claim, you must refute the database of witnesses, the unnatural mortality rates and the use of the Poisson formula. This is a spreadsheet database of witnesses and probability calculations.
Probabilities of Material Witness Deaths
Warren Commission Witnesses (1964-78):
– 15 official ruled unnatural deaths
There were 3 homicides, 1 attempted murder, 4 suicides, 6 accidents, 1 unknown. Given the 0.000295 weighted average mortality rate, the probability is P= 5.08E-08 (1 in 20 million)
– 21 unofficial actual unnatural deaths
There were 17 homicides, 2 accidents, 1 suicide, 1 unknown. Normally, 7 unnatural deaths would be expected. Given the 0.000131 weighted rate, the probability is:
P = 3.65E-20 = POISSON (21, 1.08, false)
P = 1 in 27 million trillion
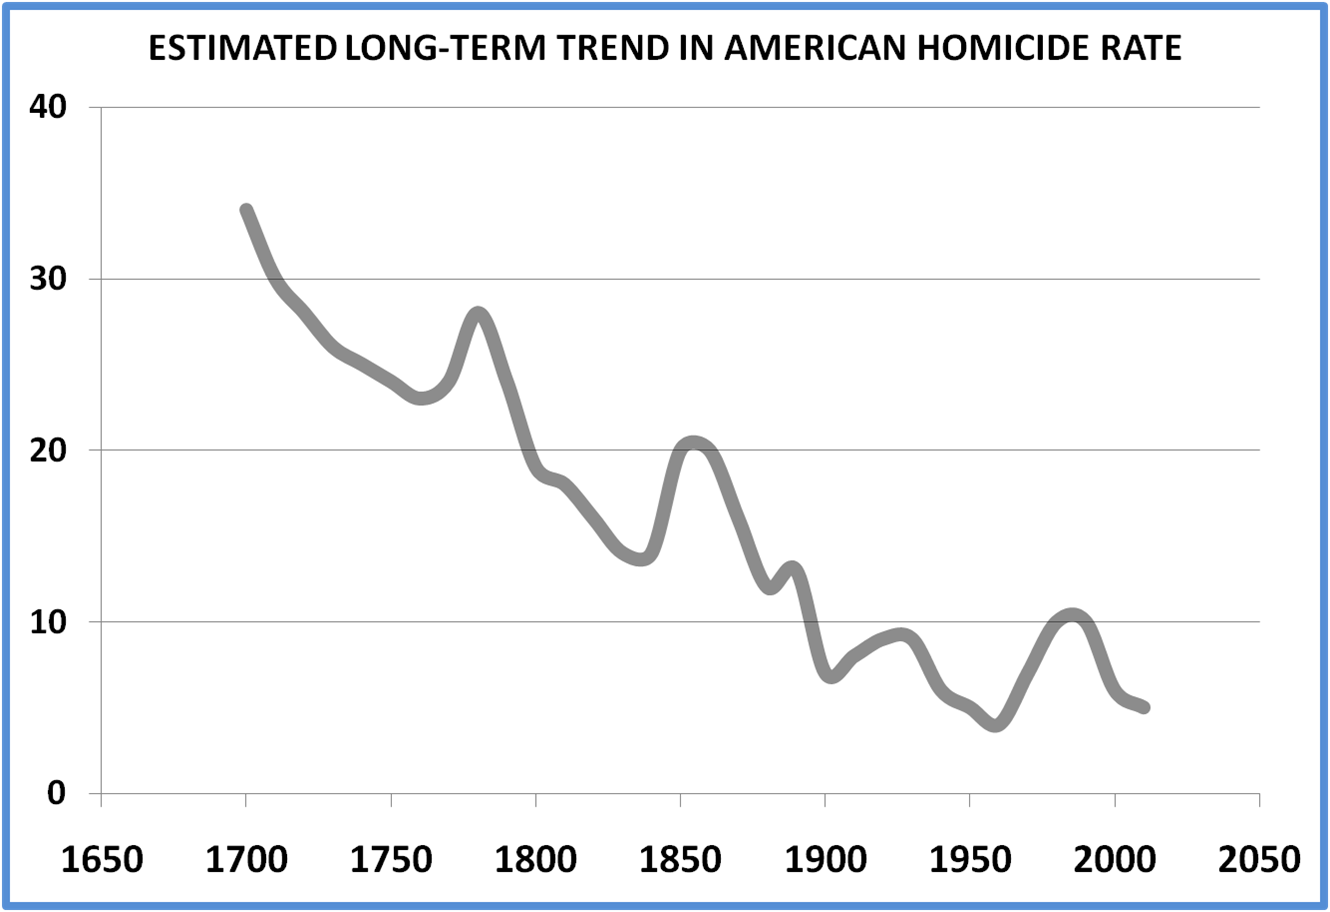
This graph shows the long-term trend in the U.S. homicide rate. In 1963 the homicide rate was 5.4 per 100,000.
Deaths by Major Causes: 1960-2011 Source: U.S. National Center for Health Statistics. The average homicide rate for 1964-1978 was 8.4 per 100,000.
At least 78 deaths were ruled unnatural (17 were expected) out of an estimated 1400 JFK-related individuals (see Benson’s Who’s Who in the JFK Assassination). The probability is based on the JFK-weighted unnatural death rate (0.000247):
P = 2.8E-62 = Poisson (78, 15*1400*0.000247, false)
P = 1 in a TRILLION TRILLION TRILLION TRILLION TRILLION.
Convenient deaths spiked in 1964 (Warren Commission) and 1977 (House Select Committee).
Election Fraud Probability Analysis
To believe election fraud is just a conspiracy theory, you must believe that
1. The Election Incident Reporting System (EIRS) indication that 86 of 88 DRE voting machines in various states flipped votes from Kerry to Bush was just a coincidence. The probability P is calculated as:
P = 1E-23 = Binomdist (86, 88, .5, false) + Binomdist (87, 88, .5, false) + Binomdist (88, 88, .5, false) or
P = 1 in 79 billion trillion
2. In the 1988-2008 elections, massive percentage discrepancies between the average recorded vote (48D-46R) and the 274 unadjusted state and national exit polls (52D-42R) were not significant. The True Vote Model (TVM) was incorrect although it confirmed the polls.
2. There was nothing suspicious in the red shift of 2008 unadjusted exit polls in 36 states to the GOP beyond the margin of error (MoE) to McCain in the recorded vote. The probability is
P = 2.4E-39 = Poisson(36,.025*50,false) or
P = 1 in 400 trillion trillion trillion!
3. In the 1988-2008 presidential elections, there was nothing suspicious in the fact that 232 (85%) of the 274 state exit polls red-shifted to the Republican. Normally, an even split (137) would be expected. The probability is: P = 4.7E-39 or 1 in 1 trillion trillion trillion!
4. There was nothing suspicious in the probability that at least 55 of 57 state elections would flip from the Democrats in the unadjusted exit polls to the Republicans in the recorded vote:
P = 1-Binomdist(54,57,.5,true)
P = 1.1E-14 = 0.000000000000011 or 1 in 88 trillion!
5. In the 1988-2008 elections, there was nothing suspicious in the 8% discrepancy between the 274 state unadjusted exit poll aggregate (52D-42R) and the recorded votes (48D-46R). There were 375,000 exit poll respondents. Assuming a conservative 1.2% margin of error, the probability is
P = Normdist(.52,.48,.012/1.96,false) = 3.51E-08 or 1 in 28 million.
6. It was just a coincidence that the exit poll margin of error (MoE) was exceeded in 131 of the 274 exit polls in favor of the Republican – and just 4 for the Democrat. The probability that the MoE would be exceeded in any state is 1 in 20. Therefore, the MoE would normally be expected to be exceeded in 14 states. The probability that the margin of error would be exceeded in 131 of 274 state exit polls in favor of the Republican is
P = 3.7E-116 = Poisson (131, .025*274, false)
P = .0000000000 0000000000 0000000000 0000000000 0000000000 0000000000 0000000000 0000000000 0000000000 0000000000 0000000000 000001
https://docs.google.com/spreadsheet/ccc?key=0AjAk1JUWDMyRdFIzSTJtMTJZekNBWUdtbWp3bHlpWGc#gid=15
Microbiologist Mystery Deaths
The unnatural deaths of 16 world-class microbiologists (8 homicides) in the four months (0.33 year) following 9/11 and the anthrax scare cannot be coincidental. Assuming 10,000 world-class microbiologists, the probability of 16 unnatural deaths in 4 months is:
P = Poisson(16,0.33*.0002*10000,false) or P= 1 in 30 trillion.
Assuming 100,000 microbiologists, P= 1 in 1000.
Eight International Bank Executives Mystery Deaths in Jan. 2014
This is a probability sensitivity analysis over a range of 5,000-500,000 bank execs: https://docs.google.com/spreadsheet/ccc?key=0AjAk1JUWDMyRdFRYUERxNDkwNGRlZkVndkc5TWFXREE&usp=drive_web#gid=0
Mysterious-deaths of 125 scientists, 75 bankers and 11 Holistic Doctors
9/11 Scientific Evidence vs. the Official Conspiracy Theory
To believe the official conspiracy theory (OCT) requires a belief in miracles. It requires cognitive dissonance of obvious explosive (WTC1 and WTC2) and symmetric (WTC7) destruction.
This group of professionals is dedicated to uncovering the truth about 9/11. http://www.consensus911.org/
Probability calculations for 9/11 are not needed; a free-fall collapse is physically impossible without explosives. Ask Isaac Newton. Office fires burn at 2000 degrees below the temperatures required to melt steel. Not one steel-framed building has ever collapsed due to fires, before or since 9/11. The probability is ABSOLUTE ZERO based on historical facts and Newtonian physics.
NIST claims that office fires caused 3 steel-framed buildings to collapse at near free-fall – a clear refutation of Newton’s Laws of Motion.
– Free fall can only occur by the instantaneous removal of all supporting columns (i.e. a controlled demolition).
– Lateral ejection of debris can only occur from explosions – not fires.
– Jet fuel burns 1500 degrees lower than required to melt steel.
– No steel-framed office buildings have ever collapsed due to fires.
CNN reporter Barbara Olson was a passenger on AA Flight 11 (which allegedly crashed into the Pentagon). She called husband Solicitor General Ted Olson from her cell phone and told him hijackers were armed with knives and box cutters.
– It was later disclosed that cell phones could not work at 30,000 feet.
– Olson then said that she called from a seatback phone. But according to an American Airlines spokesman, there were no seatback phones on Boeing 757 airliners.
– At the 2006 Moussaoui trial, the FBI reported there was one attempted call that lasted zero seconds (“unconnected”)from Barbara Olson to Ted Olson.
The BBC reported that WTC 7 collapsed at 5pm, 20 minutes before happened.
– How did the reporter know that it would collapse? Was she psychic?
– All fires burned out long before 5pm.
– Silverstein, the owner, said “pull it”.
and there is much more…
A believer of the official conspiracy theory (OCT) must ask explain how…
– William Rodriguez, a WTC janitor, would hear a loud explosion seven seconds before the plane hit, but his testimony would be ignored by the 9/11 commission.
– The NIST would fail to acknowledge free-fall until David Chandler proved it.
– The collapse of WTC 7 would occur due to structural failure of one beam.
– The 9/11 Commission would fail to mention WTC 7 or note it their Report
– For the first time in history, not one but three steel-framed buildings would collapse due to office fires.
– Airline fuel burning at 1000F would melt steel.
– April Gallop would hear an explosion next to her office at the Pentagon but not see any aircraft debris.
– NIST would not consider explosives as a possible cause of the collapses.
– NIST would admit freefall and claim it was due to office furniture fires.
– There would be traces of thermite in the lungs of first responders.
– Over 118 firefighters would imagine that they heard explosions.
– Furniture would be ejected laterally 600 feet from office fires.
– Firefighters would know that WTC 7 would collapse before it did.
– When Larry Silverstein said “pull-it” he did not mean demolish WTC 7.
– At 5pm, the BBC would report WTC7 fell, 20 minutes before it did.
– The passport of an alleged hijacker would be found in the rubble of the WTC.
– There would be no manifest record that hijackers boarded the planes.
– Put options on airline stocks would rise dramatically a few days before 9/11.
– Osama Bin Laden would not be on the FBI most wanted list for 9/11.
– 9/11 Commission heads Kean and Hamilton would disavow their own report.
– There were multiple air defense exercises conducted on 9/11.
– Officials who ignored standard response procedures would be promoted.
– Not one of the four flight recorders would be retrieved.
– There is no video, airline debris or human remains at the Pentagon.
– There is no video, debris or human remains at the Pennsylvania crash site.
– The media would not investigate these facts.
April Gallop was working at the Pentagon and never saw a plane.
Barbara Honegger presents a detailed analysis of the Pentagon scam:
http://townhallseattle.org/911-truth-seattle-barbara-honegger-behind-the-smoke-curtain/
This is what a retired general in charge of intelligence had to say:
