Five Democratic Primaries: Exit Poll Discrepancies and Win Probabilities
Richard Charnin
Updated March 20, 2016
Matrix of Deceit: Forcing Pre-election and Exit Polls to Match Fraudulent Vote Counts
Proving Election Fraud: Phantom Voters, Uncounted Votes and the National Exit Poll (E-book)
LINKS TO WEB/BLOG POSTS FROM 2004
Election Fraud Overview
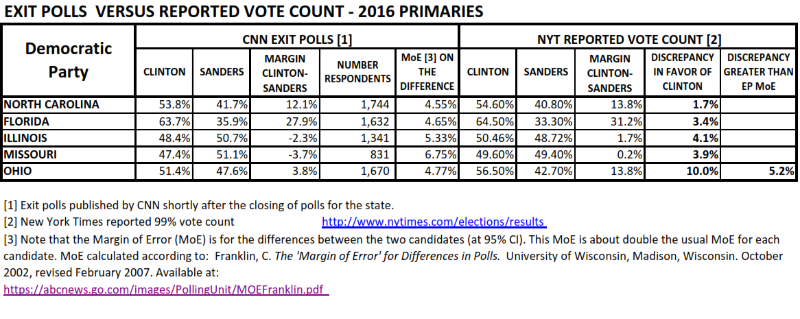
This is a summary exit poll analysis of the five March 15 Democratic primaries. It follows previous posts on the Massachusetts and Michigan primaries.
In the five unadjusted exit polls there were 7,220 respondents. Clinton led by 53.2-44.7%.
In the final adjusted polls polls, there were 7979 respondents (759 additional). She led the final adjusted polls (which were matched to the recorded vote) by 55.6-42.4%.
DATA SOURCES
The table below was created by Theodore de Macedo Soares (tedsoares@yahoo.com)
CNN is the source of the state exit polls which were downloaded shortly after closing.
The NY Times is the source of the reported vote counts.
Assuming a 30% cluster effect, the exit poll margin of error is:
MoE = 1.3*1.96 *sqrt [p*(1-p)/N], where p =2-party exit poll share, N = sample-size.
Sanders win probability is P = NORMDIST (V, 0.5, MoE/1.96, true)
V = his 2- party exit poll share. His win probability is 80% in MO and 74% in IL.
The probability of the 10% OH exit poll discrepancy is P= 0.00102 (1 in 976):
P = 1- NORMDIST(EP, VS, MoE/1.96,true), where EP=48.1% is Sanders’ 2-party exit poll share and VS=43.0% his 2-party recorded vote share.
Sanders’ exit poll share exceeded his recorded share in n= 15 of N= 16 polls.
P= 0.00026 = 1-BINOMDIST(n-1,N,0.5,true) or 1 in 3855.
There is a 99.9% probability that this anomaly was due to election fraud.
Clinton had 586 (77.2%) of the FINAL 759 respondents, or 21.9% above her unadjusted share. Sanders had 20% (24.7% below his unadjusted share). He had 37% of Democrats, 64% of Independents, 49% of males and 38% of females. But since the adjusted polls were forced to match the recorded vote, he must have done better in those categories.
In the 2014 elections, 41.6% of males and 43.2% of females voted. In the five Democratic primaries, 43.4% of males and 56.6% of females voted. In the 2014 elections, 82% of voters were white. In the five primaries, 63% were white.
The Chicago Board of Elections proved fraud in an audit to check voting machines. It was not an official recount and will not change the election outcome. A CBOE employee recounting an early voting machine corrected the tally to square with the electoral result, even though the hand-count was off by 70 votes in favor of Clinton.
Effects of Election Fraud on the Delegate count
Officially, HRC has 8,653,327 votes (58.6%), Bernie has 6,115,550 (41.4%). Applying the approximate 6.6% exit poll discrepancy (972,168 of 14,768,877 total votes), HRC has 8,167,189 votes and Bernie 6,601,688 (55.3-44.7%). Clinton leads by 306 delegates (1119-813). Applying Clinton’s adjusted 55.3% share of the current 1932 delegates, she leads by just 204 (1068-864). Super delegates are excluded. Clinton’s votes appear to have been padded in the RED states to increase her delegate count.
Primary Votes/Exit Polls
https://docs.google.com/spreadsheets/d/1sGxtIofohrj3POpwq-85Id2_fYKgvgoWbPZacZw0XlY/edit#gid=1476097125
View the spreadsheet: https://docs.google.com/spreadsheets/d/1sGxtIofohrj3POpwq-85Id2_fYKgvgoWbPZacZw0XlY/edit#gid=1710111458
| Exit Poll CNN | Clinton | Sanders | Margin |
| NC | 53.8% | 41.7% | 12.1% |
| FL | 63.7% | 35.9% | 27.8% |
| IL | 48.4% | 50.7% | -2.3% |
| MO | 47.4% | 51.1% | -3.7% |
| OH | 51.4% | 47.6% | 3.8% |
| Recorded | Clinton | Sanders | Margin | Discrepancy |
| NC | 54.6% | 40.8% | 13.8% | 1.7% |
| FL | 64.5% | 33.3% | 31.2% | 3.4% |
| IL | 50.5% | 48.7% | 1.7% | 4.0% |
| MO | 49.6% | 49.4% | 0.2% | 3.9% |
| OH | 56.5% | 42.7% | 13.8% | 10.0% |
| 2-party exit poll | Clinton | Sanders | Sampled | MoE |
| NC | 56.3% | 43.7% | 1744 | 3.03% |
| FL | 64.0% | 36.0% | 1632 | 3.03% |
| IL | 48.8% | 51.2% | 1341 | 3.48% |
| MO | 48.1% | 51.9% | 831 | 4.42% |
| OH | 51.9% | 48.1% | 1670 | 3.12% |
| Probability Analysis | Probability of discrepancy: 1 in | Probability of Discrepancy | Sanders Win Prob |
| NC | 4 | 28.0% | 0.0% |
| FL | 22 | 4.6% | 0.0% |
| IL | 8 | 13.2% | 74.3% |
| MO | 4 | 22.5% | 79.8% |
| OH | 976 | 0.1% | 11.4% |
Discrepancies in eight of nine exit polls favored Clinton in the reported vote. The average margin discrepancy was 8.5%, The 4.25% vote share discrepancy is far beyond the 9-poll margin of error (approximately 2%)
Cumulative Vote Shares (based on precinct votes) is a likely indicator of fraud.
DATA SOURCES
The tables below were created by Theodore de Macedo Soares (tedsoares@yahoo.com).
CNN is the source of the state exit polls which were downloaded shortly after closing.
The NY Times is the source of the reported vote counts.


Gus Linton
March 16, 2016 at 9:11 pm
Do any states use machines that produce a paper receipt that can be verified by the voter and collected at the polling place to provide the possibility of an audit?
Richard Charnin
March 17, 2016 at 12:41 pm
You will have to google for that info.
wlee1953William lee
March 18, 2016 at 3:19 pm
Even if they did it would take a line by line audit if the programming code to catch and illegal changes plus the paper trail! They had a man who wrote a program for the DNC to fo just that! And he went before the congressional council to explain what it did!
Daniel
March 21, 2016 at 9:27 am
Question should be… shouldn’t all state give you proof of your vote incase there is an audit?
Bev
April 15, 2016 at 1:44 pm
link provided by commenter Brit March 11, 2016 at 11:27 am via: https://richardcharnin.wordpress.com/2016/03/02/ma-primary-unadjusted-exit-poll-indicates-bernie-won/ :
https://ballotpedia.org/Voting_equipment_by_state
There is a map and if you click on Voting Equipment Usage by State, you will have a list of the information you seek.
……..
People need to stop thinking that getting a receipt of your vote from a voting machine is safe, as the machines can do the opposite of what they print out. You need real evidence of a paper ballot publicly hand counted in precinct (not taken to another site to be counted, chain of custody issues) and posted in precinct on election night, which best serves the publics’ interest.
…………
I posted a link to Richard’s above article because it shows how Illinois has a 74.3% probability of having been stolen from Bernie Sanders, to an commenter’s article, The GOP’s new plan for voter suppression, at the Chicago Cubs site, because I think they would be a very interested group of people:
http://www.forums.mlb.com/discussions/Chicago_Cubs/General/ml-cubs/1?tsn=70&nav=messages&tid=443191 comment 70 out of 75
…………..
I think this is the most telling of statistics:
via: https://richardcharnin.wordpress.com/2016/03/24/last-train-to-yuma-the-arizona-2016-democratic-primary/
https://docs.google.com/spreadsheets/d/1sGxtIofohrj3POpwq-85Id2_fYKgvgoWbPZacZw0XlY/edit?pref=2&pli=1#gid=815759394
Sanders Average Vote Shares:
66% in 13 Caucuses
(my note: with open evidence of public hand/head counts)
41% in 21 Primaries
(my note: with evidence removed/hidden by abusive owners of e-voting/e-scanning machines)
………
Maybe Sanders is saving up all this brilliant evidence from Richard (and others, see how difficult it can be even for a caucus win, an amazing story: http://usuncut.com/politics/bernie-wins-nevada-democratic-caucus/ ) to use in any contested fight for the nomination. I think it could be powerful leverage that could undo the blatant theft of votes, theft of democracy. Perhaps…
And, evidence of real bias in the leadership of Democratic Party against Sanders:
http://www.commondreams.org/news/2016/04/12/sanders-did-even-better-colorado-reported-no-one-told-him
Sanders Did Even Better in Colorado Than Reported, But No One Told Him
Democratic Party officials let Hillary Clinton’s campaign know five weeks ago, but kept Sanders in the dark
by Deirdre Fulton, staff writer
Bev
May 20, 2016 at 4:12 pm
Correcting a mistake:
Sanders Average Vote Shares:
66% in 13 Caucuses
(open evidence of public hand/head counts)
43% NOT 41% in 21 Primaries
(evidence removed/hidden by machines)
…….
Updating:
Since I linked to the CHICAGO CUBS BASEBALL TEAM to inform them of Richard’s site and how his information was important to the Illinois Democratic Primary results, I would add this update:
RECOUNT ILLINOIS
Richard was correct all along. Now to prove it is Bev Harris with new research of evidence of fraud that Richard’s numbers were catching.
Bernie Sanders should talk to Bev Harris and Richard Charnin. Then RECOUNT ILLINOIS.
http://blackboxvoting.org/fraction-magic-1/
Fraction Magic – Part 1: Votes are being counted as fractions instead of as whole numbers
By Bev Harris May 12, 2016
1 – Summary – This report summarizes the results of our review of the GEMS election management system, which counts approximately 25 percent of all votes in the United States. The results of this study demonstrate that a fractional vote feature is embedded in each GEMS application which can be used to invisibly, yet radically, alter election outcomes by pre-setting desired vote percentages to redistribute votes. This tampering is not visible to election observers, even if they are standing in the room and watching the computer. Use of the decimalized vote feature is unlikely to be detected by auditing or canvass procedures, and can be applied across large jurisdictions in less than 60 seconds.
GEMS vote-counting systems are and have been operated under five trade names: Global Election Systems, Diebold Election Systems, Premier Election Systems, Dominion Voting Systems, and Election Systems & Software, in addition to a number of private regional subcontractors. At the time of this writing, this system is used statewide in Alaska, Connecticut, Georgia, Mississippi, New Hampshire, Utah and Vermont, and for counties in Arizona, (upcoming) California, Colorado, Florida, Illinois, Indiana, Iowa, Kansas, Kentucky, Massachusetts, Michigan, Missouri, Ohio, Pennsylvania, Tennessee, Texas, Virginia, Washington, Wisconsin and Wyoming. It is also used in Canada.
snip
All:
Part 1: Votes are being counted as fractions instead of as whole numbers
http://blackboxvoting.org/fraction-magic-1
Part 2: Context, Background, Deeper, Worse
http://blackboxvoting.org/fraction-magic-2
Part 3: Proof of code
http://blackboxvoting.org/fraction-magic-3
Part 4: Presidential race in an entire state switched in four seconds
http://blackboxvoting.org/fraction-magic-4
Part 5: Masters of the Universe
http://blackboxvoting.org/fraction-magic-5
Part 6: Execution capacity – coming –
http://blackboxvoting.org/fraction-magic-6
Part 7: Solutions and Mitigations – coming –
…..
Baseball players have always been heroes to kids. Save kids and democracy.
RECOUNT ILLINOIS.
Especially now that the networks have stopped all exit polling for upcoming primaries. Elections will be blind with machines with no evidence, hidden evidence and no indirect evidence to assess validity, the unadjusted exit polls that Richard was tracking.
dersh1234
March 17, 2016 at 1:41 am
this is so depressing. can you verify these numbers? where do you access the exit polls?
Richard Charnin
March 17, 2016 at 12:33 pm
Ted Soares got the 8pm Gender crosstabs from CNN and posted on electionintegrity.org
Alicia Foy
March 17, 2016 at 9:34 am
My only thoughts are maybe Bernie people are more willing to Share? Maybe HRC people are embarrassed?
Chris McDonough
April 6, 2016 at 11:13 am
Have you ever done exit polling? Your response indicates to me that you don’t understand how it works.
whatso
March 17, 2016 at 9:46 am
What are you saying? That they “flipped” votes at the central tabulator? Vote flipping software again?
Where did you get exit polls that weren’t “smoothed” by the “actual results”? I thought they don’t release those anymore.
What can we do to prove vote fraud? FOIA the precinct tapes and compare to the central office printouts? I think they’re stealing elections and doing it badly.
Richard Charnin
March 17, 2016 at 12:23 pm
1) The fraud is accomplished in a variety of ways.
2) I was surprised when I noticed on Electionintegrity.org that Ted Soares posted Gender crosstabs (probably already adjusted somewhat). They were captured from CNN. See the blog notes.
3) I already proved Election Fraud mathematically. Beth Clarkson (PhD, Kansas) has sued for the tapes. Google.
4) You “think” they are stealing elections? They have been doing it for decades. And they have been very successful.
Election Fraud is the third-rail of American politics. No one will touch it, even those who have lost elections due to fraud.
acoleman
March 17, 2016 at 1:44 pm
Do the exit polls take into account absentee ballots? Apparently the Clinton campaign has been sending them out to elderly people as well as campaigning at nursing homes. Also, what can we do about this?
Richard Charnin
March 17, 2016 at 5:16 pm
I dont believe they do. What can we do about sending absentees to elderly people? Nothing illegal there as far as I can tell. But absentees should be cclearly identified and separated from the local precinct counts. A wide discrepancy between absentees and precinct vote shares raises red flags of possible ballot stuffing
Chris McDonough
March 17, 2016 at 4:49 pm
Time for a change. Thank you for all of your work.
kyle
March 17, 2016 at 5:49 pm
Mr. Charnin, thank you so much for this information.
Do you feel there is anything the Sanders campaign can do about this? Every delegate counts, and from my understanding in the 2008 primaries, at least two states were “contested”, thereby leaving their delegates “unaffiliated” until the convention.
Thank you.
martini
March 17, 2016 at 10:57 pm
Weirdness in reporting on Illinois results, too: http://www.dailykos.com/stories/2016/3/17/1503100/-Willie-Wilson-Illinois-Democratic-Primary-Results-Feed-Weirdness
Jerry Myers
March 18, 2016 at 12:00 am
I believe that I have conceived of a way to use a new two-step election vote tabulation process, the internet, cryptography, and (of all things) game theory to make our elections 100% untamperable, 100% transparent, and 100% accurate… Without losing the essential anonymity.
Thinking of a Kickstarter campaign to get it rolling. Contact me via voting dot integrity at gmail dot com if you are interest in (and able to) help in some way. Thank you!
Richard Charnin
March 18, 2016 at 12:11 am
I have advocated an Open Source Online database of all precinct votes which can be accessed by individuals and election fraud watchdogs after the votes have been hand-counted by three observers and posted at the precinct.
This is what we need: data transparency and data redundancy.
The problem is not a technical one. It is that politicians, election officials and the media will never allow it.
The problem is getting an Open Source fool-proof system approved.
Bruce Eggum
March 21, 2016 at 1:37 am
I agree. Each voter should have a secure account which sends to the voter a copy of their vote. If wrong can immediately report.
Tone
March 18, 2016 at 2:58 pm
Richard Charnin
March 18, 2016 at 8:35 pm
The final adjusated polls always mislead since they are forced to match the recorded (bogus) vote.
The unadjusted polls are hidden because they are close to the true vote.
The NY Times never discusses election fraud.
So much for the NY Times.
Sam
March 19, 2016 at 12:38 pm
“The NY Times never discusses election fraud.” Nor do most “progressive” blogs. I tried to put your site up at Rawstory. It was deleted as ‘spam’ at first. Wrote back that it wasn’t spam and another moderator ( I assume) put it back up. The trick is to find the shift a reasonable moderator will be working 🙂
Keep up the good work Richard. I’ve checked in on your blog when elections are occurring since seeing you as TruthIsAll at Brad’s blog.
Unfortunately though it’s still covered ears, and la la la, I don’t (want to) hear you. Very frustrating.
Debra L Grant
March 19, 2016 at 10:59 pm
Watch this HBO documentary. It is all about the voting machines and how they can and are hacked!! If this doesn’t make you very angry, it should!!!
Riley
March 20, 2016 at 11:28 pm
I had seen a court session regarding the e-voting machines being hacked.. a programmer was asked to make machines cheat in FL I believe.
FWIW the guy did say 51-49 specifically.
You would not be able to tell without a paper printout that anything was wrong.
Im an amature coder and that is a no brainer to me so… pressed, I could certainly make that very same software.
TCS
March 21, 2016 at 7:11 am
I’m trying to follow what is going on with the exit polls. What is your source for the unadjusted exit poll data? Thanks
Richard Charnin
March 21, 2016 at 10:03 am
CNN: Read the post table notes.
TCS
March 22, 2016 at 5:17 am
I’ve looked at your tables, which seem very complete. But where does the original data on the early exit polls come from? As far as I can see there’s no record of them on the CNN site, nor anywhere else on the internet.
Richard Charnin
March 22, 2016 at 12:38 pm
Of course you won’t find them. The media does not want you to see them. But look at the bottom of the table. It shows that the exit poll GENDER crosstab was posted by CNN at 8:01. If you read my blog, you will see that unadjusted exit polls are not released until years later. In fact, in 2012 the National Election Pool of six media giants decided to exit poll in just 31 states – and they no ask How Did you Voted in the Prior Election? Read my blog and you will see why.
TCS
March 23, 2016 at 5:07 am
OK, so you are saying that CNN posted the unadjusted data at 8:01 and you downloaded it. They subsequently deleted that information and there is no record of it anywhere else. Did you not screenshot it?
Richard Charnin
March 23, 2016 at 7:14 am
I never said I downloaded it. I told you to read my blog in which I provide an image of the table posted by Ted Soares on electionintegrity.org. Now I have a question for you. Why are you pursuing this – even after I have given you the facts?
TCS
March 23, 2016 at 5:42 pm
Fair enough. I’m curious about election irregularities in the Sanders-Clinton cycle, and I’m trying to establish what is valid and what is dubious.
I suppose the question about the information is then where did Ted Soares get it from? When I follow the link from your blog it just comes up with a table that looks like a screenshot of an Excel/Word file. It could have come from anywhere.
Robert Porter
March 23, 2016 at 2:44 pm
Saying 1 in 3855 chance of this not being election fraud is no where near as powerful as saying there is a 99.974% probability of this being election fraud.
Richard Charnin
March 23, 2016 at 6:13 pm
You are right. I just added it to the post.
redacted
March 24, 2016 at 3:45 am
I have been trying to replicate some of your results based on 2004 Presidential election data from Missouri. I have the precinct level data from Harvard’s Election Data Archive, and have tried to plot Republican vs Democrat vote share vs cumulative vote like you show in your plots. I did manage to obtain a linear regression curve with positive slope for Republicans and negative slope for Democrats, but R2 is only 0.01, the data looks pretty scattered. I’m interested in using your method of plotting vote share vs cumulative vote to find other likely instances of voter fraud, but I guess I just don’t understand how you arrive at your plots yet. Can you give me a more detailed procedure or perhaps some sample data? Also, the Election Data Archive only goes back to 2002, where can I find precinct level data for older elections? Presumably, once you go back far enough the elections will show a different pattern because systemically rigging votes would have been much harder before voting machines.
Richard Charnin
March 24, 2016 at 10:00 pm
Read these posts: https://richardcharnin.wordpress.com/category/2014-elections/
and link to the spreadsheet links. https://docs.google.com/spreadsheets/d/1QRNhMIwPGCsBz6bOrLUfPWudpPa2-PDMMTzREgNHAgU/edit
Easy
April 30, 2016 at 3:23 am
What is the acceptable margin of error between an exit poll and an actual vote count?
Richard Charnin
April 30, 2016 at 11:18 am
Depends on the size of the poll.
Typically for state elections (1000 respondents), I would say 3%+ cluster effect = 4%
But exit polls usually interview around 1500, some as high as 3000.