NY Democratic Primary: More Frustration
Richard Charnin
April 20, 2016
Matrix of Deceit: Forcing Pre-election and Exit Polls to Match Fraudulent Vote Counts
Proving Election Fraud: Phantom Voters, Uncounted Votes and the National Poll
Democratic Primaries spread sheet.
Election Fraud Slides
Momentum was on Bernie’s side. He had just won a solid victory in Wisconsin. Now he was coming home. A Brooklyn native, he was drawing great crowds. The following entertainers gave speeches on his behalf: Harry Belafonte, Tim Robbins, Susan Sarandon, Mark Ruffalo, Spike Lee, Rosario Dawson.
Pre-election polls showed that Hillary was a likely winner. But Bernie had the Big Mo; he would overcome the systemic fraud which plagued his campaign in the primaries.
NYC was a natural for Bernie, despite the fact that Hillary Clinton was a senator for eight years. But it was Arizona all over again. Thousands of voters reported their registrations were changed or dropped.
Only 22% of approximately 8 million registered voters turned out. Clinton won by 57.9-42.1%.
The UNADJUSTED exit poll indicated a close race. Hillary led by just 52-48%, an 11.8% discrepancy from the recorded vote. There were 1391 respondents and a 2.6% exit poll Margin of Error. Clinton led by a whopping 62-38% in the vote count with 33% of precincts reporting.
At 9:03 pm, there were 1307 exit poll respondents, Clinton led the actual count by 680-627 (52.0-48.0%). With just 84 additional respondents (1391 total), Clinton’s lead increased to 802-589 (57.7-42.3%). She had 122 additional respondents and Sanders had 38 fewer.
How could Clinton gain 122 of 84 respondents and Sanders’ total drop? It is mathematically impossible. Therefore the final vote has to be impossible as well. The exit poll was forced to match the recorded vote with impossible adjustments.
| CNN Exit poll- Gender | Clinton | Sanders |
| 1307 respondents 9:03pm | 680 | 627 |
| Vote share | 52.0% | 48.0% |
| Final EP: 1391 respondents | 802 | 589 |
| Adjusted Vote share | 57.7% | 42.3% |
| Change: +84 respondents | +122 | -38 |
This excellent comprehensive analysis confirms that THE NY PRIMARY EXIT POLL USED IMPOSSIBLE ADJUSTMENTS TO MATCH THE RECORDED VOTE.
In 2014, NY voter registration was 49D-24R-27I. The split was 85D-15I in the exit poll, which (as always) was forced to match the 57.9-42.1% recorded vote.
Assuming primary voting was proportional to registration, the split would have been 65D-35I and the race would have been a tie. If Clinton had 58% of Democrats, Sanders won the election by 52.5-47.5%.
| Final Exit Poll (adjusted) | Mix | Clinton | Sanders | Margin |
| Democrats | 85% | 62% | 38% | 24% |
| Independents | 15% | 28% | 72% | -44% |
| Total | 100% | 56.9% | 43.1% | 13.8% |
| 2014 Registration | Mix | Clinton | Sanders | Margin |
| Democrats | 65% | 62% | 38% | 24% |
| Independents | 35% | 28% | 72% | -44% |
| Total | 100% | 50.1% | 49.9% | 0.20% |
| True Vote | Mix | Clinton | Sanders | Margin |
| Democrats | 65% | 58% | 42% | 16% |
| Independents | 35% | 28% | 72% | -44% |
| Total | 47.50% | 52.50% | -5.00% |
How did the exit pollsters adjust Sanders 48% share in the NY primary at 9pm (1307 respondents) to 42% at the final (1391 respondents)? This indicates that an equivalent of 107,000 votes were flipped from Bernie to Clinton.
The pollsters had to increase the percentage of women voters by 1%, Clinton’s share of men by 5% and her share of women by 6%. The 125 increase in Clinton’s respondents among the final 84 exit poll respondents is obviously impossible. That is proof of Election Fraud in the NY Primary.
Assuming that Sanders’ 48% exit poll was accurate, he must have won the election due to thousands of suppressed votes. Sanders True Vote = 48% exit poll + suppressed vote.
The exit poll does not include approximately 400,000 disenfranchised voters (120,000 in Brooklyn and 280,000 elsewhere). Therefore Bernie must have had approximately 52%, assuming he had 70% of 400,000 disenfranchised voters.
Sanders True Vote = 52% = 48% Voted + 70% Disenfranchised
= 48%* 1790 + 70% * 400 = 860+280
= 1140 / 2190
The following table is a sensitivity analysis of Sanders share as a function of his share of the suppressed vote and the exit poll. As you can see, Sanders wins 24 of the 25 scenarios.
| Sanders% | Suppressed | Vote | |||
| Sanders | 65.0% | 70.0% | 75.0% | 80.0% | 85.0% |
| Exit Poll | Sanders | True Vote | |||
| 50% | 52.7% | 53.6% | 54.6% | 55.5% | 56.4% |
| 49% | 51.9% | 52.8% | 53.7% | 54.6% | 55.6% |
| 48% | 51.1% | 52.0% | 52.9% | 53.8% | 54.7% |
| 47% | 50.3% | 51.2% | 52.1% | 53.0% | 53.9% |
| 46% | 49.5% | 50.4% | 51.3% | 52.2% | 53.1% |
As always, the final CNN exit poll was forced to match the recorded vote. http://www.cnn.com/election/primaries/polls/NY/Dem
Probability of 11.8% exit poll discrepancy
……………..Sanders Clinton Margin
Recorded …..42.1%….. 57.9%……15.8%
Exit poll…….48.0%…..52.0%……4.0%
The probability P of the discrepancy is 1 in 126,000.
P = 1- normdist(0.579,0.52,.026/1.96, true)
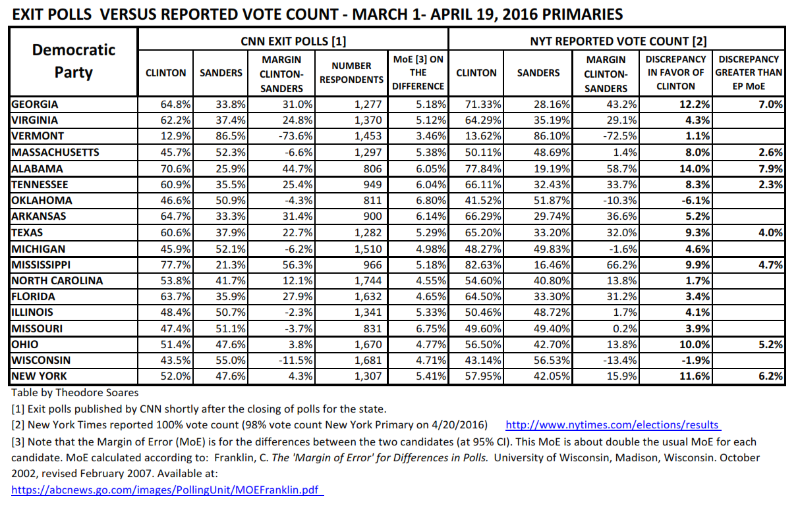
Sanders’ exit poll share declined in the recorded vote in 18 out of 19 primaries.
The probability: P=1-binomdist(17,19,.5,true) = 0.000038 = 1 in 26,000.
Cumulative Vote Shares
NY Primary Congressional District cumulative vote shares indicate a trend to Clinton with increasing district size reminiscent of increasing, non-intuitive GOP vote shares in Governor and Senate elections.
DATA SOURCES
The table below was created by Theodore de Macedo Soares (tedsoares@yahoo.com)
CNN is the source of the state exit polls which were downloaded shortly after closing.
The NY Times is the source of the reported vote counts.
| Gender | Mix | Clinton | Sanders | Margin |
| men | 41% | 50% | 50% | 0.00% |
| women | 59% | 63% | 37% | 26.00% |
| Total | 57.67% | 42.33% | 15.34% | |
| Age | Mix | Clinton | Sanders | Margin |
| 18-29 | 18% | 35% | 65% | -30% |
| 30-44 | 24% | 53% | 47% | 6% |
| 45-64 | 39% | 63% | 37% | 26% |
| 65+ | 19% | 73% | 27% | 46% |
| Total | 57.46% | 42.54% | 14.92% | |
| Race | Mix | Clinton | Sanders | Margin |
| white | 59% | 50% | 50% | 0% |
| black | 22% | 75% | 25% | 50% |
| latino | 14% | 64% | 36% | 28% |
| asian | 2% | n/a | n/a | |
| other | 3% | n/a | n/a | |
| Total | 54.96% | 45.04% | 9.92% | |
| Party id | Mix | Clinton | Sanders | Margin |
| democrats | 83% | 62% | 38% | 24% |
| republicans | 3% | n/a | n/a | |
| independents | 14% | 28% | 72% | -44% |
| Total | 55.38% | 44.62% | 10.76% | |
| Ideology | Mix | Clinton | Sanders | Margin |
| very liberal | 29% | 44% | 56% | -12% |
| somewhat liberal | 37% | 59% | 41% | 18% |
| moderate | 29% | 67% | 33% | 34% |
| conservative | 5% | n/a | n/a | |
| Total | 54.02% | 45.98% | 8.04% | |
| When decided | Mix | Clinton | Sanders | Margin |
| last week | 23% | 57% | 43% | 14% |
| earlier | 76% | 58% | 42% | 16% |
| Total | 57.19% | 42.81% | 14.38% | |
| Area | Mix | Clinton | Sanders | Margin |
| urban | 64% | 62% | 38% | 24% |
| suburban | 31% | 51% | 49% | 2% |
| rural | 6% | n/a | n/a | |
| Total | 55.49% | 44.51% | 10.98% | |
| Region | Mix | clinton | sanders | Margin |
| new york city | 52% | 63% | 37% | 36% |
| long island | 9% | 58% | 42% | 16% |
| hudson valley | 16% | 56% | 44% | 12% |
| urban upstate | 14% | 50% | 50% | 0% |
| rural upstate | 9% | 42% | 58% | -16% |
| Total | 57.72% | 42.28% | 15.44% |

Cindy
April 20, 2016 at 2:59 pm
Richard, do you have a screen shot to show the initial exit poll (before the adjustment) 48% Bernie, 52% HRC….. and can you point a summary of all voters now in the adjusted exit poll… the page above does not show a summary unfortunately. I did see myself CNN report on and show a graph for the 48% Bernie, 52% HRC and even stated it was too close to call initially… later said “some of the earlier polls indicated it would be much closer”…. without these graphics or URLs showing the before and after, it will not be as strong a case to carry to people.
Also, can you point to where you got the margin of error information? I will need this too to make a stronger case when I/we report this on social media, etc.
I took screenshots last night of the page you link to above but I think the adjustment had already been made since CNN did not release this data on that page until right after the polls closed.
Richard Charnin
April 20, 2016 at 7:13 pm
See screen shot above for the exit poll.
The margin of error is a function of the number of exit poll respondents and the vote shares. See link above.
Which social media site will you report this on?
Could you provide your contact info?
Cindy
April 20, 2016 at 8:09 pm
Hi Richard, can you see the email that I submit when I post a reply? That’s the best one to use for me. I don’t want to put it on your public blog.
I’ve posted links to your blog on various Facebook pages and I’ve sent it via email to many people. I’ve asked people to post it to Reddit but not sure if that has happened yet. I would like it to be posted to the Bernie sub.
Richard Charnin
April 20, 2016 at 8:34 pm
Good. I will look for your emails. I assume that you identify yourself as Cindy.
Cindy
April 20, 2016 at 8:37 pm
Is the “screen shot” above the table of exit polls? If so, is that from ABC?
What I’d really like to have is two screen shots of the total percentage for Bernie vs HRC from the same source, one before the “adjustment” and one after the “adjustment.” I’d like to be able to show this one stat, before and after, side by side to make it abundantly clear and super simple to grasp immediately. New York would be great but really if we could show ANY of the states in this clear way, it would be extremely convincing…. and the more the merrier of course!!
I am so totally outraged by this… something MUST be done… ASAP… and I think the first step is to boil this down into very simple terms that includes the proof in the summary. From my understanding, the proof of what you are saying hinges on the evidence that the actual data collected from exit polls are being “adjusted” after the fraudulent votes are tabulated/reported from the rigged voting machines. Thus, it would be VERY powerful to have the side by side comparisons of the before and after exit poll data…. and to keep it simple to start, so people really get it, just the total percentage of the vote for both candidates.
This would be enough to motivate people into ACTION, not just pique their curiosity. It would provide the proof, not just the premise based on math that many people have trouble thinking about.
Richard Charnin
April 21, 2016 at 1:10 pm
Well Cindy, just do it. I posted. Now it’s your turn.
Richard Charnin
April 21, 2016 at 1:14 pm
You appear to know your stuff. You should proceed to do some research on your own. Do those comparisons. I already did. Let’s see your versions.
Tina Huang
April 21, 2016 at 2:02 pm
Hi Richard,
Thank you for your amazing work and dedication. I’ve been sharing what you’ve written, but I looked at your numbers, and need some clarification. You mentioned exit poll numbers declining for Sanders in 18/19 primaries. But in your chart, I see 18, and 2 (Oklahoma and Wisconsin) appear to be favoring him. I’m wondering, am I missing something in my analysis?
Thanks so much!
-Tina
Richard Charnin
April 22, 2016 at 3:27 pm
The exit polls favored Sanders in Oklahoma.
The Wisconsin numbers you are referring to are not the unadjusted exit poll numbers. They appear to be adjusted to match the recorded vote.
The screen shot shows that he had 68% of whites in the preliminary polls, not the adjusted 59%. That is what i used.
Also the final exit poll indicated he had just 31% of blacks. Totally implausible. He had 51% in the pPP pre-election poll.
I used 40% as his percentage of blacks – which I still believe was too low.
That’s how I came up with 64% for Sanders.
Tina Huang, Ph.D.
April 21, 2016 at 2:05 pm
Richard,
I’m hoping I’ll reach you this way. I’ve tried commenting on your blog 4x now, and the comments I enter just disappear. I’m wondering, are you getting them?
I had some questions about your analyses. I don’t know if I’m interpreting your numbers incorrectly, but I need some explanation before I pass your information along.
If you get this, let me know!
Thanks for all that you do!
-Tina
On Thu, Apr 21, 2016 at 10:14 AM, Richard Charnins Blog wrote:
> Richard Charnin commented: “You appear to know your stuff. You should > proceed to do some research on your own. Do those comparisons. I already > did. Let’s see your versions.” >
Cindy
April 20, 2016 at 8:39 pm
Yes, Cindy is my real name… and a good email for me is the one I submitted with my first post to your blog and now pops up automatically when I submit, but thankfully, is not displayed on the page 🙂
Jared Diamond
April 21, 2016 at 12:47 am
From a mathematical standpoint, how does the “well people are more likely to vote in the exit poll for the more ‘exciting’/ idealistic candidate so therefore we shouldn’t trust the exit polls”. Is it complete bogus? I hear they use the example of Al Gore, who won in exit polls in “00, though you say that that election was also stolen. Should the Moe be greater due to the unreliability of exit polls?
Richard Charnin
April 21, 2016 at 1:09 pm
Jared, you need to get up to speed. Or are you just trolling? Do your homework on exit polls. I say the 2000 election was stolen? All informed observers say it. It’s common knowledge. And you question it? The exit poll margin of error a function of the number of respondents. That’s it. Have a nice day. And don’t waste my time with your not so subtle nonsense.
Gore won by 3-5 million votes.
Jared Diamond
April 22, 2016 at 1:27 pm
I totally understand that the 2000 election was stolen. Not doubting that at all. I also know that we are spoon-fed these lies about exit polls being off. I am simply wondering (because from a logical standpoint, it makes a tiny iota of sense) whether or not people would be inclined to ‘say’ they voted for someone that they didn’t actually vote for, and whether or not that would favor the more ‘exciting’ candidate. My question is: From a statistical standpoint has a slight (and I mean slight, not gore v bush-esq) favoritism happened in the past that favors the ‘exciting’ candidate before? (would this ‘excitement’ be considered within the Moe, or is there any evidence at all where such a candidate has been over the Moe in the exit poll in a race that is all paper ballots and thus almost totally reliable?)
Also, why didn’t Obama change the rules after he won, considering those districts in NY with 0 votes for him, he had a super mandate to make it fair, or did he want it hard for everyone after him? Maybe he couldn’t have changed the process, I don’t know enough.
asher27
July 25, 2016 at 2:25 am
didnt gore win the popular vote but lose the electoral college, which is why it went to SCOTUS who ruled in favor of the electoral college setting an awful precedent?
not trolling here, just seeing if my memory is working. i agree that the election was completely stolen and that florida was extremely fishy considering bush’s brother was running the show.
Richard Charnin
July 25, 2016 at 7:56 pm
Gore won the poplar vote by 540,000 recorded votes.
But he did much better than that. State and national exit polls, the True Vote Model and over 5 million uncounted votes indicate that he won by 4-5 million votes.
may
April 21, 2016 at 1:20 pm
it’s not just cnn. right at 9pm fox news exit polls also predicted a tight dem race and described the possible sanders upset as “a huge story”. you can watch megan kelly & brett baier talking about it in the first 1 minute of this video: https://www.youtube.com/watch?v=QCe2gu5ny3A
Lauren
April 21, 2016 at 2:46 pm
Thank you for providing this valuable resource. I was wondering if you plan to provide a breakdown of voting machines used by voting district in New York City. It is clear by your numbers that some of the discrepancies between the unadjusted vs adjusted polls are more egregious than others. The discrepancy in the African American vote after being adjusted too conveniently plays into the corporate media narrative that Hillary Clinton still has the black vote wrapped up. I’m wondering if neighborhoods with larger percentages of black voters had higher probabilities of vote flipping taking place. Thanks again.
Richard Charnin
April 22, 2016 at 3:20 pm
https://docs.google.com/spreadsheets/d/1sGxtIofohrj3POpwq-85Id2_fYKgvgoWbPZacZw0XlY/edit#gid=313579555
karen
April 21, 2016 at 3:25 pm
hi richard,
just wanted you to know your work is getting a lot of attention
illinois ballot integrity is doing good work too and they say they have evidence of “erasing” bernie votes and adding hc votes in the 5% required audit in chicago
http://www.democraticunderground.com/12511800403
long video of the election commissions public comment…..but basically they are doing the same thing with the audit that you have proven they do with the polling…forcing the audit results to match the pre reported output
with respect,
karenfromillinois
Dolly
April 21, 2016 at 6:31 pm
Call me Captain Obvious, but it seems to me that the bottom line is: Sanders is most likely actually winning, and yet Clinton is likely to walk away with the nomination. If there is a strong case for widespread election fraud (the exit polls plus the voter suppression and wonky audits) what can be done other than take to the streets with pitchforks? I’m just about mad enough to go the pitchfork route, by the way.
Last night I watched a video, about an hour and a half long, of citizens who observed problems with the Illinois primary, speaking to the Chicago Board of Elections. They described voters being given incorrect information, being given provisional ballots inappropriately, voters given such a hard time that they were angry, or crying, or leaving and swearing never to vote again.
Several citizens also described a very disturbing 5% audit, in which workers were told to hide ballots from the observers, and were actually erasing votes for Sanders, and adding votes for Clinton, in order to get their “audits” to match the official numbers (which they were given up front). Nothing about it seemed to be an “audit” — what multiple people described was truly terrible and dishonest.
And yet, it was clear that the people who were part of the Board of Elections were simply listening because they had to, as part of their meeting. It was crystal clear that they would acknowledge no problems, nor report any problems, nor look into these problems, nor take any sort of action (now or for future elections).
It was one of the most horrible perversions of “democracy” that I’ve ever been unfortunate enough to see: concerned citizens showing up and taking a problem to the appropriate channels, and being completely ignored. What can any of us do? The problem seems overwhelming.
Eric
April 21, 2016 at 7:06 pm
Hi Richard,
Skeptic here–was hoping you could answer a few questions. Hopefully you’re open to some skeptical inquiry about this.
1. Real Clear politics did an average of 8 different public pre-election polls. As you mention, these polls had Clinton up by an average of about 16 points, almost perfectly matching the reported vote total. Are these polls made up? You calculate that the “actual” vote would have been 52-48 Sanders. If that is the case, isn’t it really really unlikely that we would have seen these 8 public poll results?
2. The latest reported vote totals for New York are 1,054,083 Clinton, 763,469 Sanders. When you state that Sanders’ “actual” total was 48 (like the exit polls) how do you imagine the shift of six percentage points was accomplished? Were Sanders votes burned? Clinton votes invented? Having worked at the polls before in Illinois and Massachusetts I find it hard to imagine how this could have been accomplished if there were not electronic voting machines.
3. You state on your site that you think Obama had 4 percentage points of votes stolen from him in 2008 (was 51%, should have been 55%). If that is the case, then why wasn’t Obama’s first act in office to reform the electoral system. Is he unaware? Didn’t care? Complicit? Overall, if there is as much voter fraud going on as you claim, you would expect the election losers to say, well, “voter fraud.” We actually don’t see that often. Why not?
4. Science has long recognized the need to carefully guard research when the researcher has a strong opinion that might influence the results found. I am not accusing you of being influenced in this way since I don’t know you, but I would be interested in learning what specific steps you take to guard against this. Do you publish pre-analysis plans of your work? Correct for multiple comparisons?
Thanks!
Richard Charnin
April 22, 2016 at 3:12 pm
1. The exit poll matched to the final recorded vote was mathematically impossible.
2.How was the shift accomplished? You figure it out.
3. Don’t ask me to explain Obama’s lack of action.
4. I do not take any steps. I report the facts and do the math. Period.
I am a quantitative analyst who has spent a lifetime building models for defense, banks and industrials.
I suggest you review my analysis of the presidential elections:
Richard
April 21, 2016 at 9:26 pm
I think they might be adding votes to HRC’s totals while they are blocking Bernies voters by changing their status!!!
SM
April 21, 2016 at 11:13 pm
Hi Richard,
I am a Bernie Sanders supporter and know we are against powerful forces whose the goals include disenfranchising as many Bernie supporters as possible. I want to be able to use these numbers to support the disenfranchisement case; however, I have some questions…
Do the pre-adjustment (pre-9pm) CNN exit polls (52-48) include both Democrats and Independents? I don’t see a pre-adjustment breakout by party ID. If you include the independents in the mix, that would make the exit poll numbers much closer than the actual reported voting results. Of course, because of our party-machine closed primary, independents cannot vote and thus would have cast affidavit ballots which are not counted in the results. Strip the independents out of the 52-48 exit poll and that takes you closer to the reported numbers….
Your thoughts?
Thanks
Richard Charnin
April 22, 2016 at 3:00 pm
Good question. I believe that some independents voted. I used the percentage cited in the CNN exit poll.
cryptodemocrat
April 22, 2016 at 2:56 am
Problem’s been fixed.
cryptodemocrat
April 22, 2016 at 3:01 am
There’s another typo in the same line: Caption (first field in the table) contains the anomalous word “Gender”.
Frater Plecticus
April 22, 2016 at 7:18 am
The ES&S’ DS200 is the weak link in the chain. With the optional modem pack and ES&S’ EVS 5.0 election management software. I’m confident a mathematical analysis will reveal remote vote flipping.
cryptodemocrat
April 22, 2016 at 12:00 pm
Critical to the whole thing are the unadjusted totals for 9:03pm, 680 & 622 (which incidentally add to 1302; is 1307 a typo or are there 5 respondents not voting for either main candidate?). Is there another reference for these values? Do you know where one might look up similar raw exit poll totals generally?
Richard Charnin
April 22, 2016 at 2:49 pm
It is not my typo. I would not worry about it. Five is a small number.
clonalantibody
April 22, 2016 at 2:29 pm
I posted a comment about the ES&S DS 200 voting machines earlier. It had a couple of links in it so it went into moderation. I was wondering if you would look at it.
Justin
April 22, 2016 at 6:24 pm
Hi Richard, thank you for your analysis!
I was wondering what is your source for the number of respondents (1307) to the first exit poll. Do you have any screenshot or link?
I can see the total number of respondents on CNN for the final count but I can’t find any information about the first exit poll.
Richard Charnin
April 23, 2016 at 12:05 pm
It’s from CNN. Look at the table.
Richard Charnin
April 23, 2016 at 1:49 pm
Last time.
Read the table in the post. I provide a link to the 9pm exit poll as a screen shot.
The screen shot showed Clinton leading by 52-48%. The final exit poll was forced to match the recorded vote 57.9-47.1% – after 9pm.
The 1307 timeline is from the table provided by Ted Soares.
https://groups.google.com/forum/?hl=en#!forum/ElectionIntegrity
Last time.
Justin
April 23, 2016 at 7:45 pm
Thank you for your answer.
The count of 1307 is indeed available in the Google sheet https://docs.google.com/spreadsheets/d/1sGxtIofohrj3POpwq-85Id2_fYKgvgoWbPZacZw0XlY/edit?pref=2&pli=1#gid=1433317684
Also, Ted has posted the screenshots of the CNN exit polls on the Google group ( https://groups.google.com/forum/?hl=en#!topic/ElectionIntegrity/rVGPMlqAAHo ) but the count on these screenshots is 1367. I wish we would have similar screenshots saved for the 1307 count.
Anyway keep up the good work!
MiM
April 22, 2016 at 11:40 pm
Excellent, though disturbing, work, Richard. One questions:
Are CNN’s pre-adjusted exit poll results online anywhere? Your “Exit Polls vs Reported Vote Count” table says the results were published. it would be nice to have a link to that information, if it still exists.
Keep up the great work!
Richard Charnin
April 23, 2016 at 12:11 pm
As far as I know, only a few screenshot images are available, not the full unadjusted exit poll tables.
The NEP does not want you to see them. Well,maybe a few years from now.
Passy
April 24, 2016 at 5:19 am
Hi Richard or should I call you TIA. I remember how I poured over your numbers in 2004 over on DU. I’m still committed to the ole forum and posted this http://www.democraticunderground.com/10911745 recently, it’s not about exit polls but the actual results could I have your opinion on the numbers I found.
Jeff Win
April 24, 2016 at 12:16 pm
I hope you will read this entire post, as I’ve tried to include several points that might help clarify this issue. But first, a question: Why would you think that there would be 35% of Independents voting in a closed Democratic primary, with a registration cutoff date back in October. Frankly, I was surprised that even as many as 15% of the Democrat only vote was Independent.
Why do you only complain about perceived voter irregularities when Bernie loses? Has there been no voter irregularities in states he has won? I voted for him in NC because I believe in socialism as an ideal. But it’s been obvious for a while now that he has absolutely no chance of winning–so why the scorched earth tactics to make Clinton even weaker?
As a politically active attorney, I worked on the 2000 Florida recount and volunteered my time to the Kerry campaign in 2004 to help address the voter fraud in Ohio and Florida. If you googled some of that history, you’d find many of the answers to your questions regarding the how and why of exit polls and that they always merge the exit polls with the actual results once they come in. I’ve never heard of adding to the number of respondents in an exit poll as you go along. The procedure has always been to conduct new exit polls later on and then combine grand totals. It sound more like an initial exit pole of 1300 or so people and a later one of closer to 1400.
Moreover, exit poll results given out at 9:00 pm are generally conducted by 5 pm, as it takes time to tabulate from the various counties and weigh each part of data. Also, the initial exit polls cannot be released to the public until the polls close. So the 52 to 48 result was merely a snapshot in time prior to the point when somewhere around half of all New Yorkers had not yet voted. Having lived in NY half my life, I can attest that the boroughs generally vote later that do the upstate counties, so the smaller Hillary lead early on makes perfect sense.
Please keep in mind that there’s no guarantee that the 126,000 disenfranchised New York voters could very well have been Hillary supporters. Assuming the very unlikely scenario in which they were all Bernie backers and that they would all vote in a 22% turnout election, adding all of them to his total doesn’t even reduce Hillary’s 300,000 vote lead by half.
I was very disappointed when Tad Devine recently bragged that even though Clinton had won Nevada by 6 or 7 points, the Sanders campaign had successfully “pressured” several of her delegates to switch to him. Is this where part of the $46M a month is going? So, instead of Clinton winning 20 delegates to Bernie’s 15, it’s now Bernie 19, Clinton, 16. That perverts democracy and the will of the voters. And he gloated that they’re in the process of doing this in every state. Combine this with Weaver’s vow to go to the convention even if Sanders is a good deal behind in both pledged delegates and votes–and try to wrestle away the nomination by cajoling superdelegates and we’ll have another 1968 on our hands.
After Tuestay, it will be mathematically impossible for Sanders to catch up to Clinton in any regard.
If Bernie doesn’t put party and country ahead of raw ambition soon, he’ll still lose, and he’ll help elect Trump or Cruz, which will destroy not only the Supreme Court, but maybe even the country.
Richard Charnin
April 24, 2016 at 4:31 pm
I think not:
To win a majority of pledged delegates:
Sanders needs 1,231 83.63%
Clinton needs 954 64.81%
Clinton has 55.37% of delegates
Now, let’s go back to 2000, 2004 and 2008:
The exit pollsters lied about the National Exit Poll results.
Here is the proof.
https://richardcharnin.wordpress.com/category/2004-election/
Have you analyzed all unadjusted state and national presidential exit polls since 1988?
Are you aware of the fact that 135 of 274 state exit polls exceeded the Margin of Error?
And that 131 moved from the poll to the vote in favor of the Republican?
And that the probability of this one-sided shift is E-116?
Have you done anything approaching this analysis?
https://docs.google.com/spreadsheets/d/1EWaKPDUolqbN7_od8sSTNMRObfUidlVPRBxeyyirbLM/edit#gid=15
Have you seen this?
2004 National Exit Poll Timeline
11/02/04 3:59pm, 8349 respondents
Kerry 51.0%; Bush 47.0%
Click to access US2004G_3737_PRES04_NONE_H_Data-1.pdf
11/02/04 7:33pm, 11027 respondents
Kerry 50.9%; Bush 47.1%
Click to access US2004G_3798_PRES04_NONE_H_Data.pdf
11/03/04 12:22am, 13047 respondents

Kerry 51.2%; Bush 47.5%
Unadjusted National Exit Poll, 13660 respondents
Kerry 51.7%; Bush 47.0%
Data Source: Roper Center (UConn)
Unadjusted State Exit Poll Aggregate, 76000 respondents
Kerry 51.0%; Bush 47.6%
https://docs.google.com/spreadsheet/ccc?key=0AjAk1JUWDMyRdFIzSTJtMTJZekNBWUdtbWp3bHlpWGc#gid=7
Final National Exit Poll, 13660 respondents (adjusted to match the recorded vote).
Bush 50.7%; Kerry 48.3%
Click to access US2004G_3970_PRES04_NONE_H_Data.pdf
The Final was forced to match recorded vote by switching 471 (6.7%) of Kerry’s 7,064 respondents to Bush. The average within precinct discrepancy (WPD) was a nearly identical 6.5%.
The True Vote Model indicates that Kerry had 53.6%.
2008
Unadjusted State Exit Poll Aggregate, 83000 respondents
Obama 58.0%; McCain 40.5%
https://docs.google.com/spreadsheet/ccc?key=0AjAk1JUWDMyRdFIzSTJtMTJZekNBWUdtbWp3bHlpWGc#gid=1
Unadjusted National Exit Poll, 17836 respondents
Obama 61.0%; McCain 37.3%
https://docs.google.com/spreadsheet/ccc?key=0AjAk1JUWDMyRdFIzSTJtMTJZekNBWUdtbWp3bHlpWGc#gid=1
Final National Exit Poll, 17836 respondents (adjusted to match the recorded vote).
Obama 52.9%; McCain 45.8%
http://www.cnn.com/ELECTION/2008/results/polls/#USP00p1
The True Vote Model indicates that Obama had 58%.
Thanks for your interest.
Jeff Win
April 24, 2016 at 7:10 pm
Thanks for your reply. However, I have similar figures for 2000 and 2004, although I was much closer to the “problem” back then than I am now. I was hoping you’d address some of my other points, such as the initial 52/48 poll having been completed in the late afternoon before many in the five boroughs voted or had their votes tabulated, the fact that the outcome lined up almost perfectly with the final polls, that 35% is an unbelievably large number of Independents in a closed Democratic primary, that the norm is to take early and then later (separate) exit polls instead of adding a few dozen later votes to an initial exit poll as in your example, as well as the points I brought up in my last large paragraph about the Sanders’ campaign up democratic self-proclaimed delegate-swaying tactics.
Again, after Tuesday, Bernie will need right around 100% or more of the remaining delegates to win–a mathematical impossibility. Moreover, a majority of pledged delegates equals 2026, not 2383. To expect Hillary to win a majority of the combined number of pledged and superdelegates with only pledged delegates is to say that she should be required to win a majority of pledged delegates plus 351 or so. That is patently unfair. Although she was never my first choice, the writing is on the wall and, barring a total reversal on Tuesday, Bernie needs to look to the needs of the country above his own desires. I hope he becomes VP if he loses. I want to see the party unified.
Jeff, you are correct: 2026 are needed to win pledged delegates.
https://docs.google.com/spreadsheets/d/1sGxtIofohrj3POpwq-85Id2_fYKgvgoWbPZacZw0XlY/edit#gid=1368619048
I disagree. The needs of the country are not served by Hillary. Just more of the same.
I want to see a third party.
REB
April 24, 2016 at 1:49 pm
Thanks for your good work. I’ll spread the word.
Anonymous
April 24, 2016 at 7:55 pm
Hi Richard, Thanks for your accurate accounting of what went down in New York. I agree with your findings. An audit needs to take place looking into this type of election fraud and what is being done with the voting machine results and the final tally (realistically a hand count should be warranted). Have you forwarded a copy of your findings to Election Justice USA? Some type of suit needs to be filed on behalf of the voters to make sure that these types of voting result discrepancies are thoroughly looked into by a neutral party. This type of audit should not be performed by the Democratic establishment because they will not remain neutral in their audit. The voters in Arizona are being better served by taking their case to the court system to negate the election results, rather than only relying on the investigations performed by the DOJ, the Democratic Party and/or the Republican Party all of which have vested interests in the outcome of their findings. I think that it may be better for voters to take the lead on this matter and file suit so that it is not politicized against the Sanders campaign. The voters’ rights will be better protected if voter rights activists take the lead on this one.
MiM
April 24, 2016 at 11:34 pm
Eric,
1. The pre-election polls have actually CONSISTENTLY been off by about 20 points…in Hillary’s favor. Meaning, Bernie has done about 20 points better, in the actual primaries / caucuses, than the pre-election polls predicted. If that pattern had held true to form, and the polls had put Hillary up by 16, Bernie should have won NY by a handful of votes.
2. There are ways…see Chicago.
3. Others, such as myself, are complaining, but you won’t hear much about the issue from the mainstream media, for obvious reasons. I’ve posted about the exit poll vs final vote discrepancies on social media, but I’m not CNN so you wouldn’t know.
4. It doesn’t take a rocket scientist to see that the discrepancies between the exit poll results and the final vote are strong indicators of a serious problem. You just have to know that exit polls are historically very accurate, and have been used in other countries to validate, or call into question, the legitimacy of elections. Richard merely compiled the data and made some basic calculations. Not to minimize the work, which was thorough and well-done. But the math itself doesn’t require elite skills to process.
cryptodemocrat
April 25, 2016 at 6:22 am
Interesting side note: The Board of Election’s unofficial primary vote total 2,697,942 (D+R) is 20.00% of the 2014 US EAC Report’s CVAP of 13,490,697 for NY. Quite a coincidence for the ratio to end in three zeroes. Refs: http://nyenr.elections.state.ny.us/, and http://www.eac.gov/assets/1/Page/2014_EAC_EAVS_Comprehensive_Report_508_Compliant.pdf, Table 1d.
Richard Charnin
April 25, 2016 at 12:49 pm
Good catch. Should we calculate the probability that it was just a coincidence?
Passy
April 27, 2016 at 1:24 pm
Hi cryptodemocrat, see my post above for more round numbers in the results. Most of the info is in post I link to. There are many coincidences in the results.
Dan
April 25, 2016 at 11:31 am
Richard, I suggest that you change your platform away from wordpress. I also suggest you move away from the word blog. I try many times to share your material on reddit. The reddit politics section automatically removes your material because it is considered a blog. Also, many users question the legitimacy of your claims because they may see you as a “quack blogger.”
Richard Charnin
April 25, 2016 at 12:39 pm
Are you serious?
Others have linked to my blog on that site. And even if they couldn’t, do you really expect that I would move my blog from wordpress?
Your “suggestion” is laughable.
You say that many users see me as a “quack blogger”? They are the quacks.
I don’t give a damn about them
The vast majority of readers appreciate my analysis.
I see you as a quack troll.
MiM
April 27, 2016 at 5:50 pm
Here’s another bit of curious data, Richard:
Prior to the Arizona primaries, The Seattle Times published a list of the cities with the highest per-capita campaign contributions to Bernie Sanders, among the 50 largest U.S. cities. Tucson was in the top 10, with 252 contributions per 1,000 residents. One would think, then, that Bernie would have done well in Pima County, in which Tucson resides, or at least relatively well as compared to the other 15 counties in Arizona. However he lost that county 57% to 41%, doing only slightly better than he did in the state as whole. In fact, he didn’t even do better there than he did in Maricopa County, where Phoenix resides, which went for Hillary 58% to 40%. When you consider that Tucson is a fairly liberal college town with a population of modest means, and Phoenix is conservative and wealthier (and 3 times the size of Tucson), you would think that Maricopa would have gone strongly for Hillary and Bernie would have done much better in Pima, yet the vote totals for each county were more or less the same. This makes absolutely no sense.
Here’s the Seattle Times article:
http://www.seattletimes.com/seattle-news/data/seattle-is-berning-nations-biggest-donors-per-capita/
And here are the officially primary results for Arizona:
http://www.nytimes.com/elections/results/arizona
What do you think, is this yet another red flag?
Richard Charnin
April 27, 2016 at 6:49 pm
I believe Sanders won both counties.
MiM
April 27, 2016 at 6:57 pm
I assume you mean he unofficially.
MiM
April 27, 2016 at 6:58 pm
…won
Richard Charnin
April 27, 2016 at 7:07 pm
I believe he won them both. Period.
cryptodemocrat
May 3, 2016 at 12:36 pm
Recently figured out the reason to state 1305 vs. 1307 (or 1361 vs. the 1367 from Soares’ screenshot): The difference is the number of voters that preferred neither Clintorn nor Sanders. It’s not an integer for either 1307 or 1367 and varies slightly from one table to another within the reported exit poll because the report limits the table accuracy to two digits. It’s a shame that Edison Research failed to report the preferences of the Republicans in the breakdown by Party ID, they should’ve been treated the same as the “Independents”, since both must’ve been forced to use provisional ballots. Also, Mr. Charnin, I’d meant to ask you what superset of Democratic voters it is that you count as 8 million, figuring myself that it’s all those who should be registered except for Republicans. Hadn’t written you earlier because I’m still diving into the spreadsheet when I have a chance to try to understand it better. My general impression is that you’re extrapolating the Sanders/Clinton split among Independents and solving for the proportion of the aforesaid 8 million that was suppressed.
Richard Charnin
May 3, 2016 at 4:17 pm
It’s 1307 at 9pm (unqadjusted) and 1391 at the final (adjusted to match the recorded vote).
cryptodemocrat
May 3, 2016 at 6:52 pm
Sorry, I meant 1302, not 1305, as the total with votes other than Clinton and Sanders removed, given 1307 as total response figure. But today’s the wrong day for this discussion.
cryptodemocrat
May 3, 2016 at 2:54 pm
Dang, I meant 1302, not 1305.
Bryan Connors
May 14, 2016 at 5:53 am
Just wanted to comment on this:
“In 2014, NY voter registration was 49D-24R-27I. The split was 85D-15I in the exit poll, which (as always) was forced to match the 57.9-42.1% recorded vote.
Assuming primary voting was proportional to registration, the split would have been 65D-35I and the race would have been a tie.”
You are aware that it was a CLOSED primary right? You had to be registered as a Democrat in order to vote. The 15% of people in the exit poll that were classified as Independents were registered Democrats that self-identified as Independents. The number of people actually registered as Independents was 0%.
cryptodemocrat
May 26, 2016 at 7:37 am
Bryan – So the Republican category represents registered Democrats who self-identify as Republicans? Pretty dubious interpretation of ER’s tables. You’re aware of Affadavit Ballots, right?
Taylor White
June 6, 2016 at 5:56 pm
Is there a github repository with raw data and code used for this analysis?
Richard Charnin
June 6, 2016 at 6:47 pm
Github repository? Did you bother to look at the spreadsheet?
https://docs.google.com/spreadsheets/d/1sGxtIofohrj3POpwq-85Id2_fYKgvgoWbPZacZw0XlY/edit#gid=1476097125
Patty Nolan
July 30, 2016 at 1:00 am
here’s the problem I see. CNN’s exit poll data are different from what you list as the numbers in the states I checked: New York, Alabama and Ohio. Their exit polls match up almost perfectly to the results you cite. I don’t understand how you can assert fraud when the exit polls match the results. What am I missing? Here’s the source I used for the CNN exit polls: http://www.cnn.com/election/primaries/polls
Richard Charnin
July 30, 2016 at 9:56 am
What you are missing is very basic and fundamental.
You are looking at the final ADJUSTED exit polls that are ALWAYS forced to MATCH the BOGUS recorded vote.
The UNADJUSTED polls are close to the TRUE VOTE.
cjonsson1
May 17, 2017 at 5:48 pm
Richard,
Did you know about the large, low rent apartment building in Brooklyn that was owned by the Democratic Brooklyn Deputy Chief Clerk Betty Ann Canizio-Aqiil and sold in 2014, displacing a large number of Brooklyn voters? I read about it somewhere and can’t find it now.
I read that the building was bought by the Clintons.This would have effected the voter numbers in 2016.The building was to have been renovated to become a luxury apartment building. It was probably still under construction during the primaries. Since the residents were poor, they probably didn’t change their voter registrations.
Here’s an excerpt from a Mother Jones article referenced below.
“This isn’t the first time Haslett-Rudiano has made headlines. According to the Daily News, a building she owned on the Upper West Side of Manhattan was the subject of more than 20 Department of Buildings violations over the years after she’d let it fall into disrepair. The building, which she reportedly bought for $5,000 in 1976, was sold in 2014 for $6.6 million.”
Sounds fishy to me.
http://www.motherjones.com/politics/2016/04/new-york-primary-voter-purge
Thank you.
Chris Jonsson, Dallas, TX
Richard Charnin
May 19, 2017 at 8:59 am
I have heard about that but have no other info.