RSS

Tag Archives: exit poll

The Connecticut Primary: Did Clinton really win?

The Connecticut Primary: Did Clinton really win?

Richard Charnin
June 13, 2016

Richard Charnin

Matrix of Deceit: Forcing Pre-election and Exit Polls to Match Fraudulent Vote Counts
Proving Election Fraud: Phantom Voters, Uncounted Votes and the National Exit Poll 
LINKS TO  POSTS
Democratic Primaries spread sheet
Recommended reading: election fraud-Nina Illingworth

Clinton won Connecticut by nearly 18,000 votes (51.8-46.4%).

Are we to believe that CT had just a 1.4% discrepancy as shown in the adjusted CNN exit poll  while its NY neighbor had an 11.8% discrepancy ?

Assuming this ABC news preliminary exit poll screenshot is legitimate, how does one explain the 21% discrepancy between the poll and the final recorded  vote?


Image result for ABC News CT primary exit poll

The preliminary exit poll  is usually released around 4:30 pm and is  based on  approximately  two-thirds of total respondents. In the CT poll, there were 1234 respondents. Assuming 800 respondents,  the preliminary exit poll had a  4.5% margin of error. For Clinton’s share to increase by 12%  (nearly triple the MoE) for just 434 additional respondents is virtually mathematically impossible.

Vote shares  adjusted to match the final CNN exit poll

CNN Final    Exit Poll 1234 Respondents…  3.63% MoE  
Clinton Sanders Other
Men 39% 43% 55% 2%
women 61% 55% 41% 4%
Total 50.32% 46.46% 3.22%
2-party 51.99% 48.01%
Recorded 51.80% 46.40% 1.80%
Diff -1.48% 0.06% 1.42%
Votes 328,395 170,075 152,410 5,910
Margin 17,665

Vote shares  adjusted to match the preliminary ABC exit poll

Preliminary Exit Poll Clinton Sanders Other
Men 39% 25% 70% 5%
women 61% 50% 46% 4%
Total 40.25% 55.36% 4.39%
2-party 42.10% 57.90%
Recorded 51.80% 46.40% 1.80%
Diff -11.55% 8.96% 2.59%
Votes 328,395 132,179 181,799 14,417
Margin 49,620

Inline image

 
12 Comments

Posted by on June 13, 2016 in 2016 election, Uncategorized


Tags: , ,

The NY Democratic Primary Quiz

The NY Democratic Primary Quiz

Richard Charnin
April 23, 2016

There were 1307 NY Exit Poll  respondents at 9 pm and 1391 at the final – an increase of just 84 respondents.  Adjustments made to force the final 1391 exit poll to match the recorded vote in all exit poll categories are mathematically impossible. Therefore, the recorded vote was also mathematically impossible. The impossible adjustments are irrefutable proof of election fraud.

Let’s review the adjustments as a quiz.

1. At 9pm, Clinton had a) 51%, b) 52%, c) 53%
2. Clinton won the recorded vote with a) 57.3%, b) 57.7%, c) 57.9%
3. She had 28% of 18-29 year-olds. In the final she had a) 33%, b) 35%, c) 37%
4. She had 45% of males. In the final she had a) 49%, b) 50%, c) 51%
5. She had 71% of blacks. In the final she had a) 74%, b) 75%, c) 76%
6. She had 57% of Democrats. In the final she had a) 60%, b) 61%, c) 62%
7. She had 55% of Urban voters. In the final she had a) 59%, b) 60%, c) 62%
8. At 9pm, Urban voters comprised 55% of the total vote.
At the final, they comprised a) 62%, b) 64%, c) 66%

9. At 9pm, Clinton had 680 (52%) of 1307 respondents. She had 802 (57.9%) at the final (1391), an increase of 122 among the 84 final respondents.
This was a) a polling error, b) of no consequence, c)an absolute indicator of fraud.
10. At 9pm, Sanders had 622 (48%) and 589(42.1%) at the final, a 33 vote decline.
This was a) a polling error, b) of no consequence, c)an absolute indicator of fraud.

11.The probability of the 11.8% exit poll discrepancy from the recorded vote is
a) 1 in 91,000, b) 1 in 94,000, c) 1 in 102,000
12. The probability that Sanders exit poll share would be greater than his recorded share in 21 of 23 primaries is a) 1 in 13,000, b) 1 in 30,000, c) 1 in 40,000
13. In the NY Cumulative Vote Share analysis, Sanders and Clinton were tied after
a) 400,000, b) 500,000, c) 600,000 of 1.79 million total votes

Answers
1b, 2c,3b,4b,5b,6c,7c,8b,9c,10c,11c,12b,13c

 
15 Comments

Posted by on April 23, 2016 in 2016 election, Uncategorized


Tags: , , , , , , ,

Election Fraud: The 2016 Democratic Primaries

Richard Charnin
4/13/2016

77 Billion to One: 2016 Election Fraud
Matrix of Deceit: Forcing Pre-election and Exit Polls to Match Fraudulent Vote Counts
Proving Election Fraud: Phantom Voters, Uncounted Votes and the National Poll
LINKS TO  POSTS (Note: 2/2/2017 view all DEMOCRATIC PRIMARY posts)

Bernie Sanders is leading 50.4-49.6% based on the unweighted average of all 34 caucuses and primaries. Let’s accept the reasonable premise that the primaries have been fraudulent and Sanders won in MO, MA, AZ, OH,IL, IA, and NV.  Electoral votes are directly proportional to state voting population.  Clinton has won 11 RED states with 160 EV. Sanders won the other 23 states with 188 EV. The exit poll/recorded vote  tables below were created by Ted Soares.

Based on late exit polls (which had yet to be adjusted to match the recorded vote), Sanders is leading by an unweighted 52.4-47.0%.  The lead must be even greater since votes were stolen from Bernie in the RED states. Proof? Check the average 8.7% exit poll margin discrepancy from the recorded votes in the Democratic Primaries spread sheet.

Sanders’ exit poll share exceeded his recorded share in n= 17 of N= 18 primaries. The probability P=0.000072 or 1 in 13,797. The spreadsheet function is P= 1-BINOMDIST(n-1,N,0.5,true). There is a 99.9% probability that this anomaly was not due to chance and must have been the result of election fraud.

Wyoming

Bernie was a 56-44% winner in the caucus, yet Hillary won 11 of 18 delegates!  In 12 counties, 54% of Clinton’s votes were surrogates (mail-in), representing 74% of the delegates. Just 27% of Sander’s votes were surrogates. Contrast this to  the Nebraska caucus, where 20% of Clinton’s votes were mail-in.

From CNN: “A Clinton campaign aide said their ‘secret sauce’ in Wyoming was the state’s onerous vote-by-mail rules that required anyone voting by mail to have voted as a Democrat in the 2014 midterms.”  But there is no evidence of such a rule.  The aide was not named.

Wisconsin

Bernie Sanders had 563,127 votes (56.5%) and Hillary Clinton 429.738 (43.1%). But the early exit poll indicates that Bernie most likely  did even better.  At 4pm, the exit poll indicated that Sanders had 68% of white vote.  Whites comprise 88% of  WI voters. Assuming Sanders had just 40% of the non-white vote, he won the election by an estimated 64.6-35.4% (2-party).

The final adjusted exit poll was forced to match the recorded vote. It indicates that whites comprised just 83% of the vote and Sanders had just 59% of them. Blacks  comprised 10% – and Sanders had just 31% . These numbers are not  plausible. A pre-election poll from Public Policy Polling (PPP)  indicated that Sanders was  winning black voters by 51-40%.

The exit poll shows that 7% of voters were Latino (3%), Asian (2%), Other (2%). According to the pollsters,  the vote shares are NA. How is that? Was it because their respective turnout rates were too low? The pollsters could have combined the 7% as Other Non-whites. Without this information, we cannot calculate the total recorded vote shares. The abbreviated totals have Sanders winning by 52.1-40.1%. The 12% margin is close to the official recorded margin.

Arizona

Arizona is the latest poster child of election fraud,  along with Florida 2000 and Ohio 2004. Sanders won Utah (a bordering state) and Idaho primaries with nearly 80% of the vote. But he lost in Arizona by 60-38%. Who believes it?

The  National Exit Pool (NEP) of six major media conglomerates funds exit pollster Edison Research. The NEP decided not to poll AZ.  It’s as if they knew they would have to match the unadjusted poll to a bogus recorded vote; the massive discrepancies would be too obvious. But  the networks called it for Hillary  with less than 1% of the votes in. How did they know this if they did not exit poll? Luckily the Yavapai County Daily Courier did an exit poll – and Bernie led by 63-37%. Hillary won  the county by 54-43%- an impossible 37% difference in margin. But the evidence of fraud goes  much further than this one poll. In Yavapai County, 2/3 of the voters who came to the polls were not counted because the DNC system registered them as independents ! http://usuncut.com/politics/5-examples-voter-suppression-arizona-primary/).

Of the 15 Arizona counties, Maricopa (Phoenix) is by far the largest with nearly 60% of the vote. Pima County (Tucson)  is second with 16%. In the 2008 primary, Maricopa voter turnout was  54.3%. In the other 14 counties, there was a 47.2% turnout. In 2016, 13  counties had higher voter turnout rates than in 2008. The 4.1% decline (17,000 votes) in Maricopa 2016 turnout (50.2%) from 2008 is counter-intuitive. Voter  turnout in the other 14 AZ counties increased by 8.8% to 56.0%.

Based on the overall trend, Maricopa should have had an approximate 63.1% turnout. It is  a powerful indicator of  voter suppression. The  probability of the 12.9% difference  (160,000 votes) between Maricopa’s projected 62.1% voter turnout and the actual 50.2% turnout  is approximately  1 in  90 trillion.

The  probability of the  5.8% difference in voter turnout  between 14 AZ counties (56.0%) and Maricopa (50.2%) is approximately 1 in 13,000).

Super Tuesday

In the five unadjusted exit polls there were 7,220 respondents. Clinton led by 53.2-44.7%. In the final adjusted polls , there were 7979 respondents (759 additional). She led the final adjusted polls (which were matched to the recorded vote) by 55.6-42.4%. Clinton had 586 (77.2%) of the FINAL 759 respondents, or 21.9% above her unadjusted share. Sanders had 20% (24.7% below his unadjusted share).

Inline image

DATA SOURCES
The table was created by Theodore de Macedo Soares (tedsoares@yahoo.com)
CNN is the source of the state exit polls which were downloaded shortly after closing.
The NY Times is the source of the reported vote counts.

Michigan

Sanders did much better than his recorded vote in the Michigan primary.  Sanders had 590,386  votes (49.8%) and Clinton 570,948 (48.3%).   Sanders won in 73 of 83  MI counties with 56% of the vote. He won the preliminary exit poll by 52.1-45.9%, a 97% win probability. Clinton won urban counties Wayne and Oakland  with approximately 55% of the vote.

Once again, we have multiple confirmation indicating fraud: Cumulative vote shares, preliminary exit poll, absentee vote anomalies and other anecdotal information.

Cumulative Vote Shares  are a likely indicator of fraud. The lines should be nearly parallel, but invariably, vote shares rise for establishment candidates in urban Democratic counties. It should be conventional wisdom by now: in state elections, fraud abounds in heavily populated urban and suburban locations. Of course, the media never talks about it. They report the recorded numbers as if there was not a fraud factor. 

In the CVS analysis, Sanders had approximately 56% at the 600,000 mark. Notice the abrupt change to straight lines at the 600,000 vote mark. They represent the largest counties (Wayne and Oakland) which used ES&S optical scanners exclusively. 

Sanders had   54% of approximately 500,000 votes cast on AccuVote and Sequoia  voting machines. Clinton had  75% of approximately 240,000 absentee votes and  51.2% of approximately 700,000 votes cast on ES&S Mod 100 machines. The percentages are highly suspect.

Sanders’ county vote shares  were negatively correlated to machine types. The ES&S Model 100 correlation was  -0.68. The bigger the county the lower Sanders’ vote share. Wayne and Oakland counties used ES&S Model 100 optical scanners. Macomb used both ES&S and Premier/Diebold/Dominion AccuVote optical scanners.

 Massachusetts

Late changes to the exit poll indicate that the election was likely stolen.  Sanders  led the Unadjusted Exit Poll Gender crosstab  (1297 respondents) by 52.3-45.7% a 97% win probability.. The poll was captured from CNN at 8:01pm.

But as always, the exit poll was adjusted to match the recorded vote. Clinton led the adjusted exit poll (1406 respondents) by 50.3-48.7%,  a near-exact match to the  RECORDED vote margin.  But her 50.3% share was IMPOSSIBLE.  The proof is self-explanatory: How could Clinton gain  114 respondents and Sanders just 7 among the final 109 exit poll respondents?

Clinton won  by 51-49% on electronic voting machines from ES&S, Diebold and Dominion. Sanders won 68  hand-counted precincts by 58-41% (32,360 votes, 2.7% of votes cast).  He won 250 of  351 jurisdictions and had at least 58% in 110. 

There is a 97%  probability  that Sanders won the election given the 3.55% Margin of Error. The MoE includes the exit poll cluster effect  (30% of the 2.72% calculated MoE). Sanders 53.4% two-party share and the MoE are input to the Normal distribution function to calculate his win probability.

Matrix of Deceit: Forcing Pre-election and Exit Polls to Match Fraudulent Vote Counts
Proving Election Fraud: Phantom Voters, Uncounted Votes and the National Exit Poll (E-book)
LINKS TO WEB/BLOG POSTS FROM 2004

Election Fraud Overview

 
37 Comments

Posted by on April 13, 2016 in 2016 election, Uncategorized


Tags: , , , ,

Proving Election Fraud: The PC, Spreadsheets and the Internet

Proving Election Fraud: The PC, Spreadsheets and the Internet

Richard Charnin
Mar. 31, 2016

Matrix of Deceit: Forcing Pre-election and Exit Polls to Match Fraudulent Vote Counts
Proving Election Fraud: Phantom Voters, Uncounted Votes and the National Exit Poll 
LINKS TO POSTS

Election Fraud Overview

This post is an overview of major advances in technology which ultimately proved that election fraud is systemic. There were three major turning points:

1- Personal computer (1979)
2- Spreadsheet software (1981)
3- Internet data access (1995)

A BRIEF HISTORY OF COMPUTERS AND SPREADSHEET TECHNOLOGY

Before the advent of the personal computer,  mainframes and minicomputers were programmed by professionals  in major corporations. Programming was hard and time consuming. Computers were used by scientists, engineers, investment bankers and other analytical professionals.

In 1965, my first job was as a numerical control FORTRAN programmer in the aerospace industry. The 7094 IBM mainframe  was a 512k machine which required a full floor of office space. It was on rental from the U.S. Navy.

Computers grew in power and were smaller in size during the 1970s. As manager of software development in Investment Banking  at Merrill Lynch on Wall Street . I used FORTRAN to develop financial models.

In the late 1970s, personal computers were considered as toys- until the first spreadsheets appeared. All of a sudden,  one could do simple calculations without having to write complex programs. Lotus 1-2-3 had limited programming features (“macros”). I immediately converted  FORTRAN financial programs to spreadsheets  with graphics capabilities. As a consultant to major domestic and foreign  corporations I switched to Excel in 1995 . Excel was used with C++ for advanced financial data base and derivatives models.

MATRIX OF DECEIT

A matrix is just a table (rectangular array) of numbers. In a spreadsheet, the table consists of data in cells (column, row). Basic arithmetic operations applied to the matrix are sufficient to prove election fraud. 

Actual, raw unadjusted exit poll results are changed in all matrix crosstabs (demographics) to conform to the recorded vote. The crosstab “How Did You Vote in the previous  election?” has proved to be the Smoking Gun in detecting presidential election fraud from 1988-2008. 

2000

Gore won the unadjusted National Exit Poll and State Exit Poll aggregate which indicated that he won by 3-5 million votes – not the 540,000 recorded. But the National Exit Poll  was forced to match the recorded vote. The election was stolen – big time.

2000 Unadjusted National Exit Poll (13,108 respondents)
Total Gore Bush Nader Other
13,108 6,359 6,065 523 161
48.51% 46.27% 3.99% 1.23%


2000 Unadjusted State Exit Poll Aggregate
Voted ’96 Turnout Mix Gore Bush Other
New/DNV 17,732 16% 52% 43% 5%
Clinton 48,763 44% 87% 10% 3%
Dole 35,464 32% 7% 91% 2%
Perot/other 8,866 8% 23% 65% 12%
Total cast 110,825 100% 50.68% 45.60% 3.72%
110,825 56,166 50,536 4,123


2000 National Exit Poll (forced to match recorded vote)
Voted ’96 Turnout Mix Gore Bush Other
New/DNV 18,982 18% 52% 43% 5%
Clinton 42,183 40% 87% 10% 3%
Dole 35,856 34% 7% 91% 2%
Other 8,437 8% 23% 65% 12%
Total 105,458 100% 48.38% 47.87% 3.75%
105,458 51,004 50,456 3,998

2004

The Final National Exit Poll was forced to match the recorded vote (Bush won by 3 million). The election was stolen.

Kerry won the unadjusted National Exit Poll and  State Exit Poll aggregate by 6 million votes. The True Vote Model (assuming a plausible estimate of returning 2000 election voters)  indicated that he won by 10 million votes with a 53.7% share.  

                                           2004 Unadjusted National Exit Poll (13,660 respondents)
Kerry Bush Other
13,660 7,064 6,414 182
share 51.71% 47.0% 1.3%


                   2004 Unadjusted National Exit Poll
                             (implausible 2000 returning voters; Gore won by 4-6m)
2000 Voted Mix Kerry Bush Other
DNV 23,116 18.38% 57% 41% 2%
Gore 48,248 38.37% 91% 8% 1%
Bush 49,670 39.50% 10% 90% 0%
Other 4,703 3.74% 64% 17% 19%
Total 125,737 100% 51.8% 46.8% 1.5%
125,737 65,070 58,829 1,838


2004 Final Adjusted National Exit Poll
                      (Impossible Bush 2000 voter turnout; forced to match recorded vote)
2000 Turnout Mix Kerry Bush Other Alive Turnout
DNV 20,790 17% 54% 44% 2%
Gore 45,249 37% 90% 10% 0% 48,454 93%
Bush 52,586 43% 9% 91% 0% 47,933 110%
Other 3,669 3% 64% 14% 22% 3,798 97%
Total 122,294 100% 48.27% 50.73% 1.00% 100,185 94%
59,031 62,040 1,223

2008

Obama won the unadjusted National Exit Poll by 61-37% (a 30 million vote margin). He won the  State Exit Poll aggregate 58-40% (a 23 million vote margin). But the Final National Exit Poll was forced to match the recorded 9.5 million vote margin. The landslide was denied.

                                      2008 Unadjusted National Exit Poll (17,836 respondents)
Obama McCain Other
17,836 10,873 6,641 322
100% 61.0% 37.2% 1.8%


                      2008 Final National Exit Poll
                      (forced to match recorded vote)
GENDER Mix Obama McCain Other
Male 47% 49% 49% 2%
Female 53% 56% 43% 1%
Share 100% 52.87% 45.59% 1.54%
Votes(mil) 131.463 69.50 59.94 2.02


2008 Unadjusted National Exit Poll
 (plausible returning 2004 voter mix)
Voted 2004 2008 Exact match to TVM & unadj state exit pollls
2004 Implied Votes Mix Obama McCain Other
DNV 17.66 13.43% 71% 27% 2%
Kerry 50.18% 57.11 43.44% 89% 9% 2%
Bush 44.62% 50.78 38.63% 17% 82% 1%
Other 5.20% 5.92 4.50% 72% 26% 2%
Total 131.46 100% 58.00% 40.35% 1.65%
Votes 131.463 76.25 53.04 2.17


Adjusted 2008 National Exit Poll
(forced to match recorded vote with
Voted 2004 2008 impossible returning 2004 voters)
2004 Implied Votes Mix Obama McCain Other
DNV 17.09 13% 71% 27% 2%
Kerry 42.53% 48.64 37% 89% 9% 2%
Bush 52.87% 60.47 46% 17% 82% 1%
Other 4.60% 5.26 4% 72% 26% 2%
Total 131.46 100% 52.87% 45.60% 1.54%
Votes 131.463 69.50 59.95 2.02

2004 Sensitivity Analysis

How is Kerry’s vote share effected by changes in vote share assumptions? Consider the following matrices (tables). He wins all plausible scenarios. 

https://docs.google.com/spreadsheets/d/1_foUi89DGNmwspKRFTgh5tOjjba4el2GLJEJLK-M2V8/edit#gid=0

2004 True Vote Model
                    (Plausible 2000 returning voter mix)
2000 Voted Mix Kerry Bush Other
DNV 22,381 17.8% 57% 41% 2%
Gore 52,055 41.4% 91% 8% 1%
Bush 47,403 37.7% 10% 90% 0%
Other 3,898 3.1% 64% 17% 19%
Total 125,737 100% 53.6% 45.1% 1.4%
67,362 56,666 1,709
                           Kerry share of returning Gore voters
89.0% 90.0% 91.0% 92.0% 93.0%
Share of returning Bush 2000                                              Kerry Vote Share
12.0% 53.2% 53.6% 54.1% 54.5% 54.9%
11.0% 52.9% 53.3% 53.7% 54.1% 54.5%
10.0% 52.5% 52.9% 53.3% 53.7% 54.1%
9.0% 52.1% 52.5% 52.9% 53.3% 53.7%
8.0% 51.7% 52.1% 52.5% 52.9% 53.4%
      Margin (000)    
12.0% 9,827 10,859 11,892 12,924 13,956
11.0% 8,871 9,903 10,935 11,967 13,000
10.0% 7,914 8,946 9,978 11,011 12,043
9.0% 6,957 7,990 9,022 10,054 11,086
8.0% 6,001 7,033 8,065 9,097 10,130
                    Kerry share of New voters (DNV)
Kerry share of 53.0% 55.0% 57.0% 59.0% 61.0%
returning Bush 2000 voters   Kerry Vote Share  
12.0% 53.3% 53.7% 54.1% 54.4% 54.8%
11.0% 53.0% 53.3% 53.7% 54.0% 54.4%
10.0% 52.6% 52.9% 53.3% 53.6% 54.0%
9.0% 52.2% 52.6% 52.9% 53.3% 53.6%
8.0% 51.8% 52.2% 52.5% 52.9% 53.2%
      Margin    
12.0% 10,098 10,995 11,892 12,789 13,686
11.0% 9,141 10,038 10,935 11,832 12,729
10.0% 8,184 9,081 9,978 10,876 11,773
9.0% 7,228 8,125 9,022 9,919 10,816
8.0% 6,271 7,168 8,065 8,962 9,859
Kerry Win Probability  53.0% 55.0% 57.0% 59.0%  61.0%
Win Prob  (3% MoE)
12.0% 99.6% 99.8% 99.9% 100.0% 100.0%
11.0% 99.2% 99.6% 99.8% 99.9% 100.0%
10.0% 98.4% 99.2% 99.6% 99.8% 99.9%
9.0% 97.2% 98.4% 99.1% 99.6% 99.8%
8.0% 95.1% 97.0% 98.3% 99.1% 99.5%
 

Tags: , , , , ,

Mark Lindeman: Still Blowing Exit Poll Smoke After All These Years

Richard Charnin
Feb. 21, 2016
Updated: Feb.24, 2016

Reclaiming Science: The JFK Conspiracy
Matrix of Deceit: Forcing Pre-election and Exit Polls to Match Fraudulent Vote Counts
Proving Election Fraud: Phantom Voters, Uncounted Votes and the National Exit Poll
LINKS TO WEB/BLOG POSTS FROM 2004

Election Fraud Overview

Mark Lindeman: Still Blowing Exit Poll Smoke After All These Years

Mark Lindeman posts as Hudson Valley Mark on Daily Kos.  He previously posted as OnTheOtherHand on Democratic Underground  where I debated frequently with him.  The key debates are in my 456 page E-book Proving Election Fraud: Phantom Voters, Uncounted Votes and the National Exit Poll.

Mark is a prolific exit poll skeptic who has made a career trying to dismiss my analysis starting in 2005 and right up to the present. He is obsessed with discrediting my analysis whenever my work is cited. But has only succeeded in being exposed as a world-class election fraud naysayer in the process.  Mark is intelligent and writes well. But if one makes the effort to analyze the facts, his sophisticated deception and obvious agenda to misinform becomes clear. In 2006, I thoroughly debunked Mark in the Response to the TruthIsAll FAQ  (I posted as TruthIsAll).

Mark is one of the cadre of professional disinformationists in the media, academia and government. These shameless naysayers are unceasing in their attempts to discredit honest researchers who have proven that many conspiracies are factual based on solid evidence, simple mathematics and the scientific method. 

Mark commented in the Kos thread below:  “The question you answered is not the question I asked. The distinction is very substantial. I have always believed it is “possible” that massive election fraud “may” have occurred in 2004; that is true from first principles. The challenge is to assess the evidence that it did happen”.

That is not what Mark said in 2005 when he totally dismissed the evidence that the election was stolen.  It’s 2016 and Mark is still promoting the corporate media fiction that there is no proof that Bush stole the 2000/2004 elections.  That is patently false.

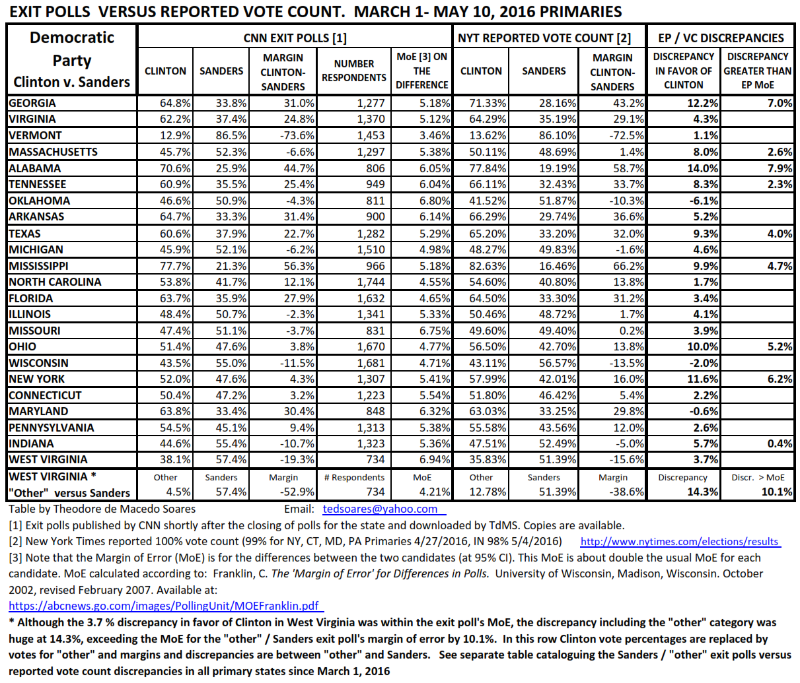
 Mark dismisses the  mathematically impossible  “red shift” in  274 state and 6 national presidential exit polls in the 1988-2008 elections.  Of the 274 polls, 135 exceeded the margin of error and 131 red-shifted to the GOP. The Democrats led the unadjusted state and national exit polls by 52-42% but won the recorded vote by just 48-46%.  The probability of the red-shift is one in trillions. How much proof does one need? It’s all in the numbers.  And the statistical evidence is overwhelming .

 I was banned from Daily Kos in 2005 for having the gall to post that Bush stole the 2004 election. Believe it or not, election fraud was a taboo topic at that time on Kos. And yet Markos Moulitsas, who claims to be a Democrat, would not allow postings claiming the election was stolen. But he had company: The NYT, CBS, CNN, FOX, AP and the Washington Post belittled  those “tin-foil hat” conspiracy theorists. 

The comments in this Daily Kos thread illustrate Lindeman’s mastery of deflection and obfuscation. The poster out of left field does a good job in defending my work. 

A few quick comments:

Mark states that the exit polls in MN, NY, PA, NH showed impossible discrepancies compared to the pre-election polls. To be precise, the exit polls were MN 56.3-42.4% vs. 51.1-47.6% recorded, NY 62.1-36.2% vs. 58.4-40.1%,  PA 56.6-42.9% vs. 50.9-48.4%, NH 56.7-42.0% vs. 50.2-48.9%. What Mark does not say is that the pre-election polls are Likely Voter (LV)  polls, a subset of Registered Voter (RV) polls. The LVs always understate the Democratic vote. Mark is saying that the exit pollsters never get it right, but the pre-election pollsters do. How ridiculous is that?  Bush stole votes in strong Democratic states to generate his bogus 3 million recorded vote margin.  

View the 2004 unadjusted exit poll stats.  Note that Kerry won the National Exit poll (13660 respondents) by 51.7-47.0%. He won the unadjusted state exit poll aggregate by a nearly identical 51.8-46.8% assuming the 2004 electorate was comprised of an implausible mix: 39.5% Bush/ 38.4% Gore  returning voters. Kerry won the True Vote by 53.6-45.1% assuming a plausible returning voter mix: 41.4% Gore/ 37.7% Bush.

 Mark states” the American National Election Studies include a panel survey in which respondents were interviewed after the 2000 election, and then again in 2004. In the data from that panel survey, we can actually see that over 7% of respondents who said in 2000 that they voted for Gore, said in 2004 that they had voted against him (for Bush). (Some respondents switched in the opposite direction.) So, the assumption that exit poll respondents accurately reported their past votes flies in the face of strong evidence from other polls. (In fact, that includes other exit polls, but I’m trying to keep things simple.) Without that assumption, Charnin’s arithmetic melts”.

Mark is the one who is melting.  The ANES study was based on RECORDED VOTE data, not the True Vote (i.e. exit poll). To claim that 2004 exit poll respondents  forgot or misstated who they voted for in 2000 is ludicrous on its face. This sleight-of-hand is analogous to Mark’ s Swing vs. Redshift argument in which he parrots exit pollster Warren Mitofsky’s argument that  zero correlation between 2000 to 2004 vote swing and 2004 red-shift “kills the fraud argument”. But this faulty logic is based on a bogus  premise that Recorded Vote Swing represents fraud-free elections. When red-shift is plotted against True Vote Swing, there is an obvious correlation in the downward-sloping graph. View this  Swing vs. red shift analysis and corresponding True Vote graph.

Catskill Julie  Oct 15 · 07:40:01 AM

I sure hope we have our own “mobs” ready

to protect those ballots and assure they are all counted this time. Mark, I didn’t look it up, but I thought in fact the exit polls were right(er) in 2000. ? Isn’t that where a lot of the distrust arose?

HudsonValleyMark  Oct 15 · 08:09:55 AM

it’s true that the exit polls were righter in 2000

I think the distrust arose because some smart-sounding people insisted, immediately after the 2004 elections, that exit polls had always (or almost always) been phenomenally accurate in the past, so accurate that they were used around the world to detect election fraud.

It was a compelling story — especially because it seemed to validate what a lot of people believed in their guts about the election in general and Ohio in particular — but it wasn’t true. While they were more accurate in 2000 than in 2004, they were pretty far off in 1992. And while the U.S. has sometimes bankrolled exit polls in countries with contested elections, neutral observers generally don’t embrace the practice.

That aside, if I had a do-over, instead of responding to all the claims point by point, I would probably point to a few of the most ridiculous exit poll results and say, “Really?!” Not that that always works.

Of course, saying that the exit polls were wrong doesn’t say much about what happened, or what could happen.

I doubt we need “mobs” to protect ballots, but in some cases observers can help. (Some states have much better ballot security than others, for sure.) Beyond that, one lesson of 2000 is that it can be damn hard actually to get the ballots recounted. The rules for that vary a lot from state to state.

out of left field  Oct 15 · 09:40:17 PM

Righter in 2000?

HudsonValleyMark wrote:

It was a compelling story — especially because it seemed to validate what a lot of people believed in their guts about the election in general and Ohio in particular — but it wasn’t true. While they were more accurate in 2000 than in 2004, they were pretty far off in 1992. And while the U.S. has sometimes bankrolled exit polls in countries with contested elections, neutral observers generally don’t embrace the practice.

What is your source for this?  How do you know that the results of exit polls in U.S. elections were more accurate in one year than another?  As far as I can tell, most observers assert such a thing because the official vote count compared to the exit polls comes up that way.  But if the official vote count has been corrupted, the argument is completely invalid.

Unfortunately, many commenters on U.S. elections implicitly assume that the official tallies are always accurate, and therefore exit polls that diverge from the official count must be incorrect.  After all, if the official tallies are not correct, in some cases by a lot, that opens up a whole can of worms that many people would rather not get into.  

Given how U.S. elections have been run the past couple of decades, with the increasing use of easily hackable electronic voting machines and tabulators, the potential for corrupting the vote has certainly been there.  One way of detecting such corruption is to look at exit polls versus the official count and see if there are any revealing patterns.  

Well, there are patterns and they are very disturbing, tending to point at wholesale manipulation of voting totals by Republican-connected voting machine makers.  If you want to deflect attention from this, one way would be to point to the exit polls and say that they are the source of the errors.  The problem with this is, if exit polls were just unreliable, over time and many elections, no one party would consistently benefit from official vote counts varying from the exit polls.  But, the phenomenon of “red shift” has been noted in election after election.  This cannot be accidental, or a matter of unreliable polling.  

By the way, it may not be impossible that Kerry really did win New York State by 30 points in 2004, etc.  I remember the confidence many activists had in how well Kerry was doing, and their utter shock when the official results came in.  Even by 2004, the course Bush had been following in invading Iraq and the like was already very controversial–it was not a given that he had anywhere near majority support for what his administration was doing.

HudsonValleyMark Oct 16 · 06:56:53 AM

I was trying to follow Julie’s lead

Frankly, I’ll be shocked if you can make a plausible case that the exit polls weren’t more accurate in 2000 than in 2004. But I’m happy to restate that: the discrepancies between the exit polls and the official counts were generally smaller in 2000 than in 2004.

But if the official vote count has been corrupted, the argument is completely invalid.

Actually, it isn’t, because we can compare both the exit polls and the official vote counts with other information sources. By way of modest example, Iagain invite you to consider Minnesota, New Hampshire, and Pennsylvania in 2004.

There’s no reason to assume a priori that either the exit polls or the official counts are correct. It’s likely that, in some sense, both are routinely wrong, although we don’t know a priori how wrong. That should be the starting point of analysis.

Well, there are patterns and they are very disturbing, tending to point at wholesale manipulation of voting totals by Republican-connected voting machine makers.

I should believe this because you say so? Or you actually have some evidence?

If you want to deflect attention from this, one way would be to point to the exit polls and say that they are the source of the errors.

You haven’t presented any facts for me to “deflect attention from.”

The problem with this is, if exit polls were just unreliable, over time and many elections, no one party would consistently benefit from official vote counts varying from the exit polls.

Malarkey.

(1) Circular reasoning. You haven’t demonstrated that any party ever has “benefit[ed]” from the discrepancies between the exit polls and the official counts.

(2) Semantic equivocation. If by “just unreliable” you mean “unbiased but inconsistent,” then your assertion is tautologically true — but irrelevant. If the exit polls are subject to bias, it is eminently plausible that the bias tends to be in one direction.

(3) Handwaving. You have barely addressed the facts about exit polls in one election; it’s wildly premature to generalize.

By the way, it may not be impossible that Kerry really did win New York State by 30 points in 2004, etc.

It may not be impossible? That’s nice, but if that is your standard of proof, then obviously a rational discussion cannot proceed very far.

out of left field  Oct 16 · 07:50:20 PM

Re: Marlarkey, etc.

Hudson Valley Mark wrote:

(1) Circular reasoning. You haven’t demonstrated that any party ever has “benefit[ed]” from the discrepancies between the exit polls and the official counts.

I have not demonstrated such a thing, but Richard Charnin has.  

Oh, I forgot, you don’t like Mr. Charnin, in your opinion he produces “crap”.  Well, please show us where Mr. Charnin has gone wrong.  The link above references a fairly lengthy article, “1988-2008 Unadjusted Presidential Exit Polls: A 51.8-41.6% Average Democratic Margin”, in which Richard Charnin documents the existence of “red shift” when comparing state exit polls to the official counts in presidential elections during the years cited.  Charnin is clear about his data sources and about the methodology he uses to come to his conclusions.  

Therefore, if he has messed up, you should be able to tell us why.  I am really interested in your conclusions, as this is an important issue and you have some very definite opinions about it.

HudsonValleyMark  Oct 16 · 09:14:39 PM

you’re still demanding that I do all the work

If you can walk me through at least one argument in Charnin’s screed that you actually understand, take seriously, and are prepared to defend, then we might have some basis for discussion. Your unsupported assertion that Charnin demonstrated something has no more force than if you had linked to an article that “demonstrates” that the Twin Towers were sabotaged with thermite, or that the earth is less than 10,000 years old, or that climate change is a hoax.

I’m willing to discuss any of those propositions, but if you can’t even provide evidence that you actually believe them, there is no point in my trying to change your mind. Charnin was banned here years ago, but if you think he is some misunderstood prophet, why don’t you tell us all what we’re missing?

a fairly lengthy article… in which Richard Charnin documents the existence of “red shift” when comparing state exit polls to the official counts in presidential elections during the years cited.

Facepalm. Why would we need a “fairly lengthy article” for that? We already knew that the exit polls don’t match the official counts. The claim to be supported is that any political party “benefit[ed]” from the discrepancies.

So, can you cite any evidence of error in the official counts? Bear in mind that your current position on exit poll accuracy is that the 2004 New York estimate “may not be impossible.” If that is the strongest statement that you can muster, apparently you concede that the exit polls can’t be assumed to be accurate. Now what?

Seriously, if there is something Charnin has written that you thought was strong evidence of vote miscount, and you want to know why it wasn’t, I’m willing to engage. But it’s flat-out nuts for me to try to guess what, if anything, you actually thought made sense. Or maybe you didn’t think any of it made sense, exactly, but it just sounded so darn smart. How can I know if you don’t tell me?

out of left field  Oct 16 · 09:51:52 PM

Here’s a walk-through

HudsonValleyMark wrote:

Seriously, if there is something Charnin has written that you thought was strong evidence of vote miscount, and you want to know why it wasn’t, I’m willing to engage.

Here you go–from Charnin’s blog as of April, 2012, Fixing the Exit Polls to Match the Policy.  In the quote, he is discussing how the 2004 National Exit Poll was “adjusted” to match the official vote results by changing various weightings of voter shares in novel ways:

Consider the 12:22am National Exit Poll timeline – before the vote shares were inflated for Bush. It shows a) a net Kerry gain of approximately 4.0 million from 22 million new voters, b) a 1.0 million net gain from returning Bush and Gore voter defections, c) a 1.5 million net gain in returning Nader voters, and d) a 540,000 gain based on Gore’s recorded margin. That’s a total net Kerry gain of 7.0 million votes. But it was surely higher than that. If we assume conservatively that Gore won by 4 million (based on the 2000 unadjusted state exit poll aggregate), then Kerry had 53.6% and a 10.5 million vote landslide – matching the True Vote Model.

So how did Kerry lose?

How come the published Final National Exit poll indicates that Bush was a 50.7-48.3% winner? The pollsters forced the NEP to match the recorded vote by implying there were 6 million more returning Bush 2000 voters than were still alive in 2004 – an impossible 110% turnout. And even that sleight-of-hand was not enough; they had to inflate Bush’s 12:22am shares of returning and new voters to complete the match in the Final NEP.

Note that Charnin is basing his argument on state and national exit poll data, as reported by the pollers themselves (Edison-Mitofsky).  The 12:22am exit poll was a preliminary result that was downloaded from a web site (the WAPO site, I believe) and contained data that had not been forced to match the official vote count.  Charnin is here showing how the matching to the official vote count was forced by using entirely unrealistic assumptions about the number of returning Bush voters that voted in the 2004 election.

As you can see, this parsing of statistics can get a little lengthy, which is why in previous comments I provided links instead of quoting everything I was referring to.  But apparently, you don’t want to bother with links.  I also thought you were conversant with Charnin’s basic analysis of presidential elections and exit polls, given your categorical put-down of same, but you just keep saying “you’re making me do all the work.”  

This will not do.  Richard Charnin has made a strong statistically based argument that analysis of unadjusted exit poll data indicates electoral fraud is going on in our elections. Is there something wrong with his methodology?  Is he making assumptions that are unwarranted? What is it that you object to about his work? Anything?  

HudsonValleyMark  

thanks for showing up

You haven’t done much to discuss my substance (Minnesota, New Hampshire, Pennsylvania, New York), but I’m willing to discuss yours.

So, let’s see where Charnin goes wrong.

Charnin is here showing how the matching to the official vote count was forced by using entirely unrealistic assumptions about the number of returning Bush voters that voted in the 2004 election.

No, he isn’t.

We’re not discussing “the number of returning Bush voters that voted in the 2004 election.” We can’t be, because we have no way of knowing that. What we know is how many people, on their exit poll questionnaires, said they had voted for Bush.

(Many of Charnin’s errors have this character of confusing exit polls with reality. Consider: “If we assume conservatively that Gore won by 4 million (based on the 2000 unadjusted state exit poll aggregate)….” Guess what: unless we assume that the 2000 exit polls are accurate, there’s nothing “conservative” about assuming that Gore won by 4 million votes. I’m skipping over a bunch of technical issues.)

As a matter of logic, then, Charnin’s argument already has a gaping hole: He is assuming the accuracy of the “unweighted” exit poll results in order to argue for their accuracy. The argument isn’t exactly circular, because at least two kinds of “accuracy” are at issue: whether the realized sample is unbiased within random sampling error, and whether the responses are factual. Charnin is in trouble if the sample is “inaccurate” in either sense. The exit poll results in Minnesota, New Hampshire, Pennsylvania, and New York — which, among other problems, defy all pre-election expectations I’ve ever seen — stand as unrebutted evidence that the sample isn’t unbiased.

But the assumption that people accurately report past votes fails, too. In the 1989 General Social Survey, 53% of respondents reported having voted for George H. W. Bush and 45% for Mike Dukakis — not too far from the official count, by the way. In the next three GSS administrations, Bush’s reported vote share was much higher. In the 1993 GSS, Bush “won” by 70% to 29%. The most parsimonious explanation is that a lot of people misreported whom they voted for.

Moreover — as Charnin has known for years — the American National Election Studies include a panel survey in which respondents were interviewed after the 2000 election, and then again in 2004. In the data from that panel survey, we can actually see that over 7% of respondents who said in 2000 that they voted for Gore, said in 2004 that they had voted against him (for Bush). (Some respondents switched in the opposite direction.)

So, the assumption that exit poll respondents accurately reported their past votes flies in the face of strong evidence from other polls. (In fact, that includes other exit polls, but I’m trying to keep things simple.) Without that assumption, Charnin’s arithmetic melts.

I’ve presented two specific examples, but if you look at GSS and ANES data, you can see for yourself that present or past incumbents’reported vote shares generally do increase over time (although usually not as much as in the 1993 GSS).

As you can see, this parsing of statistics can get a little lengthy

Yes, but the statistics are basically irrelevant, because Charnin’s assumptions are bogus. It’s logically possible that part of his argument somehow can be salvaged — but the apparent excess of Bush 2000 voters in the weighted 2004 exit poll results is what we would expect, given the general propensity I described above. The GSS and NES data are freely available for download, and in many cases can be analyzed via UC-Berkeley’sSurvey Documentation and Analysis archive.

out of left field  Oct 17 · 08:32:16 PM

Thanks, at last, for a serious answer.

I will be looking at the sources that you cite to see what I can learn.

HudsonValleyMark  Oct 17 · 09:49:20 PM

y’know, all my answers have been serious

The fact that you find Charnin credible, and I don’t, doesn’t make your comments more serious than mine. But it’s one of those fundamental disconnects. If you find Charnin credible and I don’t, I suppose you will consider that you’re making an important point just by citing him, while I consider that you’re making no point at all. It’s more interesting to be talking about actual arguments, I think.

Lovepolitics2008 Oct 14 · 10:27:43 PM

Time to alert the international community?

I mean… this is ridiculous. The USA are like a banana republic. The national media won’t cover this abomination. Maybe it’s time we alert the international media to what’s happening in the USA. The shenanigans in Florida, Ohio, and God knows where else. It’s getting ridiculous and scary. The republicans are totally out of control.

If you live outside the USA, try to send a message to the journalists of your country who are covering american politics and ask them to do some digging.

HudsonValleyMark  Oct 15 · 02:57:28 AM

so, Rove has the magic wand and wouldn’t share?

Sorry, that makes no sense.

rubyr  Oct 15 · 10:13:21 AM

if you choose to view it as a magic wand that’s

on you. The reality is quite a bit more chilling and dangerous. Why don’t you read a few books and articles about it. For instance the book I mentioned above, written by a very respected author or any of the many books on Karl Rove that you can get from your public library, Amazon or on your Nook. Anyone who does not view Karl Rove as a clear and present danger is just not paying attention.

HudsonValleyMark  Oct 15 · 05:59:24 PM

stop hiding behind borrowed authority

I’ve read dozens of books and articles about it. Now what?

The question isn’t whether Karl Rove is “a clear and present danger.” The question seems to be whether Karl Rove can steal any presidential election he pleases, more or less by snapping his fingers, but decided to let 2008 go because he hates John McCain.

But if you don’t like that paraphrase of the question, I’m happy to hear the question in your own words. Only, make your own argument; don’t tell me to go read stuff and figure out what your argument is. You can cite sources to support your argument, but you have to make it first.

out of left field Oct 14 · 11:19:14 PM

Good diary, but…

I would recommend including a little of the story you linked to so your readers can get a better idea of what’s involved.  

Regarding your question:

Why , when there are computer errors do they always favor the republicans….Patiently awaiting answers…….

It’s called “red shift” and is definitely an indication that everything is not on the up and up in our elections.  I did a diary on the subject back in June, reporting on an important article on the subject by Bob Fitrakis in The Free Press web site.  You can do worse than to check it out.

tvdude  Oct 14 · 11:33:50 PM

Thanks for the tips…

Bob Fitrakis has been at the heart of this matter for some time…read your diary…excellent stuff!!

HudsonValleyMark  Oct 15 · 03:39:48 AM

the problem with exit polls…

is that in 2004, the exit polls projected that Kerry would win Minnesota, New Hampshire, and Pennsylvania by 14-15 points each, and New York by over 30. And so on. Most of the largest discrepancies weren’t even in swing states.

Conceivably you believe that those projections were correct within sampling error. You’re not likely to convince neutral political observers. That’s a major reason why the argument hasn’t caught on: it’s a bad argument, and Bob Fitrakis should have known that for years.

out of left field  Oct 15 · 04:40:38 PM

Your thesis

if I understand it correctly, is that exit polls in general are unreliable indicators of the actual vote.  But the examples you give were all taken from an election that was almost certainly corrupt, in a big way.  

To repeat a segment of the article that inspired my diary:

Charnin looked at 300 presidential state exit polls from 1988 to 2008, 15 elections would be expected to fall outside the margin of error. Shockingly, 137 of the 300 presidential exit polls fell outside the margin of error.

What is the probability of this happening? “One in one million trillion trillion trlllion trillion trillion trillion,” said Charnin….132 of the elections fell outside the margin in favor of the GOP. We would expect eight.

Here we have a guy who has done real statistical analysis of exit polls versus the official count.  He not only finds the exit polls trending well outside the margin of error in a shocking number of cases, he finds a bias towards one side that is really something.  

This cannot be explained by anything other than direct manipulation of vote totals.  If exit polls were just no good, we would expect the discrepancies to be all over the map–essentially random in a large study.  But Charnin finds anything but randomness.  Face it.  The fix is in.

HudsonValleyMark  Oct 15 · 06:10:33 PM

you talked right past my point

The problem with exit polls is that in 2004, the exit polls projected that Kerry would win Minnesota, New Hampshire, and Pennsylvania by 14-15 points each, and New York by over 30.

If the best you have to say about that is that the 2004 election was almost certainly corrupt, you are missing the point.

Here we have a guy who has done real statistical analysis of exit polls versus the official count.  

No, there we have a guy who has done crap, at length, for years. If you care to argue otherwise, step right up. Maybe you can start by discussing the four states I’ve mentioned. Do you think those exit poll results are plausible?

out of left field  Oct 15 · 08:18:45 PM

Re: you talked right past my point

Are you saying that the exit poll results in Minnesota, NH and PA in 2004 were wrong, and therefore, exit polls cannot be relied upon?

Do you know for a fact that the official counts in those states were correct, and therefore the exit polls were wrong?

You say Charnin has “done crap for years”.  Show me some evidence please.  Where has he been incorrect?

HudsonValleyMark  Oct 16 · 05:23:11 AM

LOL

Yes, I understand, you’ll ask the questions around here. That is the hallmark of crap CT: the burden of proof is always on the skeptic.

I’ll give you another chance to answer the simple question that you ducked: Do you think those exit poll results are plausible?

Welcome to Daily Kos, where extraordinary claims demand extraordinary evidence. If you really believe, in any worthy sense of the word, that Charnin’s work supports your weirdly smug conclusion that “the fix is in,” then why not marshal an argument, instead of appealing to dubious authority?

I’ve encountered many fans of Charnin, but no one who can explain and defend his analyses in detail. Not that I care whether you defend Charnin’s analyses, per se: feel free to offer your own.

But if that is too ambitious, you might start by answering my question about the exit poll results.

out of left field  Oct 16 · 07:33:01 PM

Re: LOL

I do not know if the exit poll results you cite have problems or not.  But YOU make an awful lot of claims that you do not back up, while accusing other people of producing “crap”.  If you are going to make that sort of charge, you need to provide some sort of evidence for it.  So far all you have done is throw charges at Mr. Charnin’s work.  If you have some evidence for those charges, produce it in a comment or give us a link.

HudsonValleyMark Oct 16 · 07:57:52 PM

umm, why?

Dude, you’re apparently alleging massive election fraud in which leading Democrats are more or less complicit. I’m alleging that Richard Charnin’s work is bad. Which one of those is an extraordinary claim? Which of those even matters? Why do you expect me to do all the work? Are you even interested in this topic, or are you just yanking my chain?

Do you actually believe that massive fraud occurred in 2004? If so, for heaven’s sake, aren’t you going to say why?  Do you have something better than that it isn’t impossiblethat Kerry won New York by over 30 points? Talk about weak tea….

out of left field  Oct 16 · 08:34:17 PM

Re: umm, why?

You are going around in circles.  You allege that Richard Charnin’s work is bad.  Fine.  Tell us why.

Yes, I believe it is possible massive election fraud may have occurred in 2004.  The work of Richard Charnin and others informs my belief.  If you cannot explain why you think his work is no good, you cannot address the issue.  (Hint: Follow the link.)

HudsonValleyMark  Oct 17 · 08:08:48 AM

see above, but, goalpost shift noted

Yes, I believe it is possible massive election fraud may have occurred in 2004.

The question you answered is not the question I asked. The distinction is very substantial. I have always believed it is “possible” that massive election fraud “may” have occurred in 2004; that is true from first principles. The challenge is to assess the evidence that it did happen. You don’t have to profess certainty — in fact, you probably shouldn’t — but you could at least state a non-trivial opinion.

Pardon my impatience, but I’ve watched people move the goalposts in this direction many, many times.

kainah Oct 15 · 02:45:04 AM

Want more reason to worry?

Read the new book called “Boss Rove” by Craig Ubgar which talks about the sleazy vote manipulation that has likely occurred under Rove’s tutelage in the past. I think there is real cause for concern which is also why I think it’s imperative that we ensure that PBO has too big a win margin the tamper with. But if, god forbid, that fails, we all have to be ready to fight like hell in the aftermath. No lying down and getting run over like in FL 2000.

HudsonValleyMark  Oct 15 · 03:52:30 AM

what in that book are you discussing?

Some people seem to think that Unger made a strong case for SmarTech tampering in that book, but I couldn’t find the case.

reflectionsv37 Oct 15 · 03:28:14 AM

I developed software for 35 years…

and I wrote this diary back in 2006 that details a hypothetical way of programming a touch screen monitor voting program to push the vote to one party while simultaneously minimizing the possibility of being detected. It’s far more simple than most people imagine.

I think it will probably answer your question!

out of left field Oct 17 · 01:56:59 AM

Your 2006 diary is superb

A quote from it:

Allowing private corporations, who have a vested interest in the outcome of an election, who have openly stated their preferences for one political party over another, to develop and implement a voting system using such an easily manipulated tool as a computer is a grave threat to our Democracy.

And reflectionsv37 explains exactly why.  I urge everyone on this thread to go read it.

reflectionsv37  Oct 17 · 03:09:18 AM

Thanks for the compliment!

It didn’t get much attention at the time. I haven’t heard many complaints this election season about votes being switched, but if I start hearing it again, I’ll rework it and try to shorten it a little and repost it so others might get a chance to see it.

HudsonValleyMark Oct 15 · 03:33:33 AM

I don’t agree with the premise of your question

I get called paranoid, and a CT, but please answer one question for me and then I’ll calm down :  Why , when there are computer errors do they always favor the republicans….Patiently awaiting answers…….

I don’t agree that computer errors always favor the Republicans. Sometimes Democrats pick up votes when errors are corrected (as, apparently, in Palm Beach, although that election was nonpartisan on the ballot). Sometimes Republicans do (as in the Wisconsin Supreme Court election last year). Sometimes the errors occur in primaries (Pottawattamie County, Iowa). These were various kinds of errors; there is no evidence of fraud in any of them.

Susan Bucher is right to be concerned that her systems are unreliable and her vendor is, too. That isn’t a CT. Making claims of fact without raising a finger to support them — and telling people to Be Very Afraid, but nothing else — is exactly what a lot of us consider CT.

Fisticuffs Oct 15 · 04:54:18 AM

The fact that Bain OWNS the machines in Ohio

right now – Bain Capital owns the company that owns and has distributed voting machines for Ohio – the company’s president is a FORMER FUCKING CAMPAIGN MANAGER for ROMNEY – is HORRIFYING to me. The fact that the MSM has TOTALLY ignored this and won’t report on it before the election is fucking STAGGERING.


Leave a comment

Posted by on February 21, 2016 in Uncategorized


Tags: , , , , , , , ,

2014 Election : Why won’t the National Election Pool Release UNADJUSTED exit polls?

Richard Charnin
Nov.8, 2014

2014 Election: Why won’t the National Election Pool Release UNADJUSTED exit polls?

Look inside the books:
Reclaiming Science:The JFK Conspiracy
Matrix of Deceit: Forcing Pre-election and Exit Polls to Match Fraudulent Vote Counts

JFK Blog Posts
Probability/ Statistical Analysis Spreadsheets:
JFK Calc: Suspicious Deaths, Source of Shots Surveys;
Election Fraud: True Vote Models, State and National Unadjusted Exit Polls

The analysis of 1988-2014 election anomalies has been proven beyond any doubt that Election Fraud is systemic. If the Democrats or the Republicans were interested in fair elections, election fraud would have been eliminated long ago.  This is apparent based on the historic overview and analysis of election fraud.

In 2012,  the National Election Pool (NEP)  came to realize that unadjusted polls were a clear indicator of fraud  so they just stopped polling in 19 states. And we only have  adjusted state and national exit polls, so that the ability to prove election fraud based on unadjusted exit polls and true vote analysis is reduced.

It’s not just the exit polls that are manipulated. Pre-election Registered Voter (RV) polls are reduced to a Likely Voter (LV) subset, eliminating many new, mostly Democratic voters, as noted by  Jonathan Simon: Vote Counts and Polls: An Insidious Feedback Loop

The pattern is repeated in every election cycle:  a) Registered Voter (RV) pre-election polls  are reduced to a Likely Voter (LV) subset (eliminate many new Democratic voters) and b) unadjusted exit polls are forced to match the recorded vote (4-5% red-shift to GOP).

In 2014, the Republicans won the House recorded vote by 52.3-46.6%. According to the final, adjusted National Exit poll, they won by 51.9-46.1%. The .01% difference in margin was not due to perfect polling of a fraud-free election. It was due to the standard procedure of matching the exit poll to a fraudulent recorded vote.

Final vote shares were calculated for all 2014 National Exit Poll categories. But the actual exit poll responses are adjusted to match the recorded vote. UNADJUSTED STATE AND NATIONAL EXIT POLLS ARE ALWAYS FORCED TO MATCH THE RECORDED VOTE. But we never get to see the unadjusted polls until years later, if then.

Therefore, voters must demand to view the unadjusted exit polls (including polled precincts).  To paraphrase Alec Baldwin in Glengary Glen Ross: The unadjusted national exit polls are gold, but you don’t get them. They’re for closers (the corporate media).

2014 National House Exit Poll

Gender...Mix...Dem... Rep..Other Margin
Men......49.0% 41.0% 57.0% 2.0% 16.0%
Women....51.0% 51.0% 47.0% 2.0% 4.0%
Total..........46.1% 51.9% 2.0% 5.8%
Recorded.......46.6% 52.3% 1.1% 5.7%
Diff............0.5% 0.4% 0.9% 0.1%


The unadjusted national exit polls and the aggregate of state exit polls (adjusted only for state voting population) have closely matched the True Vote Model in all presidential elections since 1988. The True Vote Model has the Democratic margin at 53-41%; the unadjusted state and national exit polls are identical: 52-42%.

The Democrats won the 1988-2008 recorded vote by just 2% (48-46%). There is a consistent 8% exit poll margin discrepancy from the recorded vote. But we don’t have the unadjusted 2014 National Exit Poll. Based on 1988-2008 margins, 2014 would be expected to show a 50-48% unadjusted (true) Democratic margin- and eliminate the 4% red shift to the GOP.


This is an excellent paper from mathematician Kathy Dopp:

Click to access USElections2014.pdf

TRACK RECORD
Election Model Forecast; Post-election True Vote Model

1988-2008 State and National Presidential True Vote Model https://docs.google.com/spreadsheet/ccc?key=0AjAk1JUWDMyRdGN3WEZNTUFaR0tfOHVXTzA1VGRsdHc#gid=0

1968-2012 National Presidential True Vote Model https://docs.google.com/spreadsheet/ccc?key=0AjAk1JUWDMyRdFpDLXZmWUFFLUFQSTVjWXM2ZGtsV0E#gid=4

2004 (2-party vote shares)
Model: Kerry 51.8%, 337 EV (snapshot) https://docs.google.com/spreadsheet/ccc?key=0AjAk1JUWDMyRdGN3WEZNTUFaR0tfOHVXTzA1VGRsdHc#gid=0
State exit poll aggregate: 51.7%, 337 EV
Recorded Vote: 48.3%, 255 EV
True Vote Model: 53.6%, 364 EV

2008
Model: Obama 53.1%, 365.3 EV (simulation mean) http://www.richardcharnin.com/2008ElectionModel.htm
Recorded: 52.9%, 365 EV
State exit poll aggregate: 58.0%, 420 EV
True Vote Model: 58.0%, 420 EV

2012 (2-party state exit poll aggregate shares)
Model: Obama 51.6%, 332 EV (Snapshot) https://richardcharnin.wordpress.com/2012/10/17/update-daily-presidential-true-voteelection-fraud-forecast-model/
Recorded : 51.6%, 332 EV
True Vote Model: 55.2%, 380 EV

 
Leave a comment

Posted by on November 8, 2014 in 2014 Elections, Election Myths


Tags: , , , , , , , , , , , ,

Comparing 2012 to 2008: Late Votes, Total Votes and 2008 Exit Polls

Comparing 2012 to 2008: Late Votes, Total Votes and 2008 Exit Polls

Richard Charnin
Dec.13, 2012

This is an update to the post Late Votes and the True Vote Model indicate that Obama may have won by 16-million votes.

A table of 2012 late and total votes and corresponding 2008 votes and unadjusted exit polls has been added to the 2012 model. It reveals a pattern of intriguing similarities which strengthen the case that the 4-5% systemic election fraud factor reduced Obama’s True Vote margin by approximately 10-12 million.

The 2008 Election Model projected a 53.1% vote share for Obama and 365.3 expected EV; he had 52.9% and 365 EV. The model utilized Likely Voter (LV) polls which understated Obama’s True Vote share.

Anticipating the systemic 5% fraud factor, the 2012 True Vote Forecast Model included two projections: 1) the recorded vote based on Likely Voter polls (Obama had 51.6%) and 2) the True Vote based on estimates of returning 2008 voters and corresponding vote shares of returning and new voters. The recorded vote projection exactly matched Obama’s 332 EV. In the True Vote Model, he had 55.2% and 380 EV.

In 2008, Obama had 52.3% on Election Day and 52.87% of the total 131.1 million recorded votes. He had 59.2% of 10.16 million late votes. In 2012, Obama had 50.34% on Election Day and 51.03% of the total 129.13 million recorded votes. He had 58.0% of 11.68 million late votes. The 2.0% differential between Obama’s 2012 and 2008 late vote shares matches the spread between his 51.03% total share and his 52.87% share in 2008.

In 2008, Obama had 58.0% in the unadjusted state exit poll aggregate (82,388 respondents) and 61.0% in the National Exit Poll (17,836). He also had 58.0% in the True Vote Model If the exit polls and the True Vote Model are accurate, then the 10.16 million Late Votes accurately represented the 2008 electorate. Obama’s 59.2% late vote share was right in the middle of the 58-61% exit poll range. In 2012, there were just 31 state exit polls. The unadjusted state and national polls have not been released.

Obama had a 56.1% two-party share in the 2012 post-election True Vote Model. It is likely that the 5% Fraud Factor resulted in his 51.0% recorded share.

Was the Late Vote a legitimate proxy of the True Vote? To find out, we need to weight (multiply) each state’s late vote share by its total vote. In 2008, Obama won the weighted aggregate Late Vote by 57-39%, the same 18% margin as the unadjusted state exit polls and the True Vote Model. In 2012, he won the weighted Late Vote by 54-42%; the 12% margin matched the 56-44% two-party True Vote Model.

The 2012 unadjusted exit polls are unavailable. But it is reasonable to assume that Obama would have 56% in the aggregate poll (2% below his 2008 aggregate share) given the 2% difference between Obama’s 2008 and 2012 late vote shares.

2008/2012 correlation:
Late Vote: 0.84
Recorded Vote: 0.98
2008 Late Vote/Exit Poll: 0.74
Late % of Total Vote: 0.83

Florida
2008: 405,000 late votes, Obama 50.9% recorded, 51.6% late, 52.1% exit poll
2012: 166,000 late votes, 49.9-49.3% recorded on Election day;
57.8-41.2-1.0% late
More than 200,000 Florida voters were discouraged by long lines and left without voting – most were for Obama.

Ohio
2008: 500,000 late votes, 51.4% recorded, 54.0% late, 54.1% exit poll
2012: 228,000 late votes, 50.3-48.3% recorded on Election Day;
57.1-31.8-11.1% late

Virginia
2008: 249,000 late votes, 52.6% recorded, 65.4% late, 62.5% exit poll
2012: 160,000 late votes, 50.6-47.8% recorded on Election Day;
64.7-34.2-1.1% late

Track Record: Election Model Forecast; Post-election True Vote Model

2004 Election Model (2-party shares)
Kerry:
Projected 51.8%, 337 EV (snapshot)
Recorded: 48.3%, 255 EV
State exit poll aggregate: 51.7%, 337 EV
True Vote Model: 53.6%, 364 EV

2006 Midterms
Regression Trend Model Projected Democratic Generic share: 56.43%
Unadjusted National Exit Poll: 56.37%

2008 Election Model
Obama
Projected: 53.1%, 365.3 EV (simulation mean);
Recorded: 52.9%, 365 EV
State exit poll aggregate: 58.0%, 420 EV
True Vote Model: 58.0%, 420 EV

2012 Election Model
Obama Projected: 51.6% (2-party), 332 EV snapshot; 320.7 expected; 321.6 mean
Adjusted National Exit Poll (recorded): 51.0-47.2%, 332 EV
True Vote Model 56.1%, 391 EV (snapshot); 385 EV (expected)
Unadjusted State Exit Polls: not released
Unadjusted National Exit Poll: not released

 
1 Comment

Posted by on November 30, 2012 in 2012 Election


Tags: , , , , , , ,

Late Votes and the True Vote Model indicate that Obama may have won by 16 million votes

Late Votes and the True Vote Model indicate that Obama may have won by 16 million votes

Richard Charnin
Dec. 21, 2012
Updated Jan. 1, 2013

In 2012, Obama had to once again overcome the persistent 4-5% fraud factor. In each of the 2000, 2004, and 2008 presidential elections, Democratic Late Votes recorded after Election Day have closely matched the unadjusted state and national exit polls – and the True Vote Model.

Why would anyone expect that 2012 would be any different? This analysis indicates that Obama did much better than his recorded 51.03-47.19% margin (4.97 million votes) and won by nearly 16 million votes. So what else is new?

This analysis does not include the millions of voters who were disenfranchised and never voted. In Florida, 49,000 voters got tired of waiting on lines for eight hours and went home. Had they voted, Obama would have won by more than 20 million votes.

In 2012, there were 129.132 million votes, of which 11.677 million were recorded after Election Day. Obama won these late votes by 58.0-38.3%, a 7.7% increase over his 50.3% Election Day share.

The 2008 late vote result was similar. Obama had 52.87% of 131.37 million total votes. He had 52.3% of 121.21 million votes recorded on Election Day, but won 59.2% of 10.2 million late votes, a 6.8% increase over his Election Day share.

True Vote Sensitivity Analysis

Pollsters and pundits and academics never do a sensitivity analysis of alternative turnout and vote share scenarios. Is it because they have never been exposed to this critical analytical modeling tool? Or is it that using it would raise issues that they would rather not talk about?

In the True Vote Model, Obama won all plausible scenarios.

Base case assumptions
1. Obama had a 58% vote share in 2008
This is his unadjusted state exit poll aggregate share (82,388 respondents) and True Vote Model. He won the unadjusted National Exit Poll (17,836 respondents) by 61-37%.
2. Equal 95% turnout of living Obama and McCain voters.
3. Obama had 90% of Obama and 7% of returning McCain voters.
(net 3% defection of returning Obama voters to Romney)
In 2008, Obama had 89% of returning Kerry and 17% of Bush voters.
4. Obama had 59% of new voters.
In 2008, Obama had 73% (two-party) of new voters.
Obama wins by 15.8 million votes with a 56.1% (two-party) share.

Implausible: Match to the Recorded vote

I. Vote shares required to match
Obama had 82% of returning Obama and 7% of returning McCain
(net 11% defection advantage to Romney)
Obama has 51.8% (2-party) and wins by 4.8 million votes.

II. Returning voters required to match
Voter turnout: 71% of Obama voters and 95% of McCain voters
Obama has 51.9% (two-party) and wins by 5.0 million votes.

Pundits, Naysayers and the Myth of Fair Elections

Just 31 states were exit polled in 2012. But unadjusted state and national polls are not available. As always, only the final adjusted state and national exit polls are displayed on mainstream media websites. As always, all exit poll category cross tabs were forced to match the recorded vote. There has never been any indication on the part of the exit pollsters that this practice will ever change.

The “How Voted in 2008” category is not included. Perhaps because it has proven to be a very useful tool in proving election fraud. In each of the 1988, 1992, 2004 and 2008 elections, in order for the National Exit Poll to match the recorded vote, it was forced to assume that there were millions more returning Bush phantom voters from the previous election than were still living.

It must have been written in stone: There is no such thing as Election Fraud. It is just a conspiracy theory. All elections are squeaky clean. The only poll that counts is the one held on Election Day. The recorded vote is the same as the True Vote. There is no justification in responding to analyst requests to view raw precinct exit poll/recorded vote data.

The usual suspects may try to thrash this analysis and call it another “conspiracy theory”. Or they will avoid discussing it. But 2012 confirms that only systemic election fraud could be the cause of the massive red-shift in the 1988-2008 Democratic unadjusted state and national exit polls (52-42%) and True Vote Model (53-41%) to the recorded 48-46%. The probability of the 8% differential is 1 in trillions. In the six elections, there were approximately 90,000 National Exit Poll respondents and 370,000 state exit poll respondents.

Pundits and naysayers are quick to accept the recorded result as gospel. They will perpetuate the myth of fair elections and point to Obama’s solid 5 million vote margin. But once again, a Democratic landslide was denied by election fraud.

Based on the historical record, late votes recorded after Election Day closely matched the unadjusted state exit polls. But exit poll naysayers cannot use the bogus faith-based canard of a systemic built-in differential exit poll response; Democrats are more anxious to be interviewed than Republicans or that exit poll respondents misrepresented their vote. They cannot use those arguments because the analysis is based on recorded votes, not exit polls. They will have to come up with an explanation to refute the persistent pattern of late recorded votes breaking sharply to the Democrat.

Late Vote vs. Election Day Share

The late vote timeline shows that Obama’s lead was steadily increasing. The consistent incremental late vote share is very telling. But the day to day changes in his total share do not tell the full story. One must consider the difference between Total Late Vote and Election Day shares.

If Late Votes are within 3% of the True Vote, it is a confirmation of systematic election fraud. The question needs to be asked: Why do late votes always show a sharp increase in the Democratic vote share?

2000: 102.6 million votes on Election Day. Gore led 48.3-48.1%.
Gore had 55.6% of the 2.7 million late votes.

2004: 116.7 million votes on Election Day. Bush led 51.6-48.3%.
Kerry had 54.2% of the 4.8 million late 2-party votes.

2008: 121.0 million votes on Election Day. Obama led 52.3-46.3%.
Obama won 10.2 million late votes by 59.2-37.5% He won the 131 million recorded votes by 52.9-45.6%, a 9.5 million vote margin. But he did much better in the unadjusted National Exit Poll: 61-37% (17,836 respondents, a 31 million vote margin. He also won the unadjusted state exit poll aggregate (82,388 respondents) by 58.0-40.5%, a 23 million margin. Obama had an identical 58.0% in the True Vote Model, exactly matching and confirming the state exit polls.

2012: 117.456 million votes on Election Day. Obama led 50.3-48.1%. He won the 129.132 million total recorded vote by 3.8% (51.0-47.2%), a 4.9 million margin. But he won the 11.677 million late votes by nearly 20% (58.0-38.3%).

In addition, Obama had a 56.1% True Vote (2-party) vs. 52.0% recorded. When the late state vote shares are weighted by total votes cast, Obama’s 56.3% (2-party) share is close to his 56.1% True Vote. This is a strong indicator that late votes are at least fairly representative of the total electorate.

Unadjusted 2012 state and national exit polls are not, and never will be, available. The mainstream media does not want you to know the truth about this, or any other, election.

Obama vote margin

Total:51.03-47.19% (3.84% margin; 129.132 million votes);51.96% 2-party
Election Day: 50.34-48.07% (2.27%; 117.456); 51.15% 2-party
Late vote: 57.99-38.29% (19.70%; 11.677); 60.23% 2-party
Weighted late vote: 53.97-41.83% (12.14%); 56.33% 2-party
True Vote Model: 56.11-43.89% (12.22%); 2-party)

The Early Vote
In 2008, the lowest exit poll discrepancies were in the states that had the highest percentage of early voting on paper ballots. Obama had 61% in the 2008 National Exit Poll, 58% in the aggregate of the state exit polls. The assumption is that Obama did approximately 3% better in late absentee and provisional ballots than he did in early voting.

Obama’s 56.1% True Vote (no fraud) calculation assumes he had 56% on Election Day, matching his early voting share. The Late Vote share is known exactly.

If the election was fraud-free, it is unlikely that Obama’s Election Day margin would differ from his early vote margin by more than 2%. But who can believe the unverifiable machine vote counts on Election Day?

In 2008, states with the highest percentage of early votes (WA, OR, CO, etc.) had the lowest exit poll discrepancies – and were strong Obama states. There were 131.3 million recorded votes of which 40.6 million (30.6%) were cast early on hand-delivered or mail-in paper ballots. The mail-in ballots accounted for 31.7% of all early votes.

Calculating the Election Day Vote

The only unknown component is Obama’s early vote share. If we had this statistic, his Election Day share is a simple calculation. Early vote total estimates gave Obama 55% in selected battleground states. He had 60.2% of the late 2-party recorded vote and 52.0% of the total 2-party recorded vote. Assuming he had 55% of early voters, then Romney needed 51% on Election Day to match the recorded vote. This is implausible and clearly indicates fraud.

This table determines the election day vote shares required to match the recorded vote given the early, late and total vote shares.

How Voted....... Votes Pct Obama Romney
Early voting.... 40.6 32.0% 55.0% 45.0%
Election Day.... 75.0 59.1% 49.0% 51.0%
Late Votes...... 11.2 8.9% 60.2% 39.8%

Recorded........ 126.8 100.0% 51.9% 48.1%
Votes (millions)............... 126.8 65.9 61.0

Sensitivity Analysis

Given Obama’s 58.0-38% margin for the 11.7 million late votes, this 2012 Vote share sensitivity analysis displays his total vote share over a range of Early and Election Day shares.

........ Obama Election Day %
........ 49.0% 52.0% 56.0%
Early.... Obama Share
56.0% 52.2% 54.0% 56.4%
55.0% 51.9% 53.7% 56.1% < True Vote
49.0% 50.0% 51.8% 54.1%
....... Margin
56.0% 5.7 10.2 16.2
55.0% 4.9 9.4 15.4 < True Vote
49.0% 0.0 4.5 10.5

2012 Late Vote Timeline
On……Obama led by…
Nov. 8 50.34-48.07% of 117.45 million recorded votes
Nov. 9 50.43-47.97% of 119.58 (2.13 late)
Nov.10 50.51-47.87% of 122.20 (4.75 late)
Nov.11 50.52-47.86% of 122.58 (5.13 late)
Nov.13 50.55-47.82% of 122.94 (5.49 late)
Nov.14 50.61-47.76% of 123.73 (6.27 late)
Nov.16 50.66-47.69% of 124.69 (7.24 late)
Nov.20 50.73-47.61% of 125.53 (8.07 late)
Nov.25 50.80-47.50% of 126.87 (9.41 late)
Nov.28 50.88-47.38% of 127.74 (10.29 late)
Nov.29 50.90-47.36% of 127.87 (10.42 late)
Dec.05 50.94-47.31% of 128.36 (10.90 late)
Dec.21 50.96-47.28% of 128.74 (11.28 late)
Final
Dec.31 51.03-47.19% of 129.13 (11.68 late)

Election Day and Late vote shares
(Late votes in thousands)
* indicates suspicious anomaly
href=”http://en.wikipedia.org/wiki/United_States_presidential_election,_2012″>wikipedia.org United_States_presidential_election,_2012


................EDay Late Late Votes (000)
Total...........50.3% 58.0% 11,677

Alabama.........39% 37% 312 *
Alaska..........41% 40% 80
Arizona.........43% 47% 666 *
Arkansas........37% 36% 25
California......59% 63% 3,609 *
Colorado........51% 54% 222 *
Connecticut.....51% 59% 1,307 *
Delaware........59% 80% 0
D. C............91% 90% 50
Florida.........50% 53% 182 *
Georgia.........45% 49% 47 *
Hawaii..........71% 72% 0
Idaho...........32% 33% 45
Illinois........57% 65% 130 *
Indiana.........44% 49% 88 *
Iowa............52% 63% 24 *
Kansas..........38% 37% 39
Kentucky........38% 29% 117 *
Louisiana.......58% 41% 1
Maine...........56% 57% 64
Maryland........62% 65% 236 *
Massachusetts...61% 55% 132 *
Michigan........53% 71% 222 *
Minnesota.......53% 79% 6
Mississippi.....44% 46% 85
Missouri........44% 71% 12
Montana.........42% 40% 49
Nebraska........38% 44% 27
Nevada..........52% 69% 3
New Hampshire...52% 35% 10
New Jersey......58% 61% 327 *
New Mexico......53% 60% 13
New York........63% 68% 902 *
North Carolina..48% 48% -4 *
North Dakota....39% 15% 3
Ohio............50% 59% 229 *
Oklahoma........33% 32% 2
Oregon..........53% 58% 330
Pennsylvania....52% 43% 292 *
Rhode Island....63% 60% 29
South Carolina..44% 47% 111 *
South Dakota....40% 44% 0
Tennessee.......39% 40% 8
Texas...........41% 43% 53
Utah............25% 23% 106
Vermont.........67% 65% 61
Virginia........51% 65% 160 *
Washington......55% 57% 1,217
West Virginia...36% 36% 29
Wisconsin.......53% 48% 15 *
Wyoming.........28% 25% 3

___________________________________________________________________

State and National Exit Polls

The late votes can be viewed as a proxy for the unadjusted state exit polls. The exit poll naysayers cannot use the worn out bogus claim that a) late poll “respondents” misrepresent how they voted and b) there is a differential response: Democrats are more anxious to be interviewed than Republicans.

But all we have is the 2012 National Exit Poll which is always forced to match the recorded vote. It shows that Obama was a 50-48% winner. All demographic crosstabs were forced to conform to the recorded vote.

The National Exit Poll crosstabs and corresponding True Vote adjustments show that the Democrats had a 39-32% Party-ID advantage. In 2004, the Final NEP 37-37 split did not agree with the pre-election survey 38-35%.

Similarly, Bush’s 53% approval rating did not match the unadjusted exit poll 50% or the 11 pre-election poll 48% average. The bogus 53% National Exit Poll approval had the effect of inflating Bush’s total share to match the recorded vote.

In 2012, about 80 questions were asked of over 25,000 exit poll respondents. But the most important crosstab was missing: Who did you vote for in 2008? Maybe it’s because it resulted in an impossible returning voter mix in each of the 1988,1992,2004 and 2008 elections.

That’s why the True Vote Model always determines a feasible mix of returning voters based on prior election votes cast – and the bogus adjusted Final Exit Poll that is forced to match the recorded vote is replaced by the True Vote – which reflects True Voter Intent.

Early and Late Vote Questions

If the Late Votes are representative of the total vote, they are another confirmation of systematic election fraud.

– Why would the late votes always show a sharp increase in the Democratic vote share?

– Could it be that since the winner has been decided, there is no longer an incentive to steal the late recorded votes?

– Could it be that early and late votes match the unadjusted exit poll aggregate and the True Vote Model because they are cast on paper ballots (provisional, absentee) and not on computers?

– Could it be that the bulk of late votes are in Democratic strongholds? That may account for some of the discrepancy, but not all. In 2012, Obama had a 54.0-41.8% margin when the late state vote shares were weighted by the total state vote (56.3% of the 2-party vote) – very close to the 56.1% True Vote Model.

Consider…
1) Late votes are cast on paper ballots, not DREs or optiscans.
2) There is no incentive to miscount votes after the election.
3) Democratic late vote shares always far exceed Election Day shares. This is indicative of a structural phenomenon.
4) Blacks, Hispanics and Asians votes increased for Obama in 2012. Since the total vote declined, there were fewer white voters, increasing Obama’s total share.
5) When late shares are weighted by total state votes, Obama’s 14.8% margin far exceeds his 2.3% Election Day margin.

Democratic late vote discrepancies from Election Day shares may not be proof of systemic election fraud by itself. But fraud has already been proved; late votes are a strong confirmation. Given the anomalies, there is no reason why an analysis of early and late recorded votes are ignored in the mainstream media and academia. Without an accurate composition of early/late vote demographics, we cannot know to what degree they are representative of the electorate as a whole.

This analysis has indicated why Obama would be expected to do better in early and late voting than on Election Day. The question is: How much better?
_______________________________________________________________________

Track Record: Election Model Forecast; Post-election True Vote Model

2004 Election Model (2-party shares)
Kerry:
Projected 51.8%, 337 EV (snapshot)
Recorded: 48.3%, 255 EV
State exit poll aggregate: 51.7%, 337 EV
True Vote Model: 53.6%, 364 EV

2006 Midterms
Regression Trend Model Projected Democratic Generic share: 56.43%
Unadjusted National Exit Poll: 56.37%

2008 Election Model
Obama
Projected: 53.1%, 365.3 EV (simulation mean);
Recorded: 52.9%, 365 EV
State exit poll aggregate: 58.0%, 420 EV
True Vote Model: 58.0%, 420 EV

2012 Election Model
Obama Projected: 51.6% (2-party), 332 EV snapshot; 320.7 expected; 321.6 mean
Adjusted National Exit Poll (recorded): 51.0-47.2%, 332 EV
True Vote Model 56.1%, 391 EV (snapshot); 385 EV (expected)
Unadjusted State Exit Polls: not released
Unadjusted National Exit Poll: not released

 
8 Comments

Posted by on November 26, 2012 in 2012 Election


Tags: , , , , , , , ,

A Reply to Nate Silver’s “Ten Reasons Why You Should Ignore Exit Polls”

A Reply to Nate Silver’s “Ten Reasons Why You Should Ignore Exit Polls”

Richard Charnin (TruthIsAll)
Oct. 29, 2010
Update: March 25, 2013

Nate, this is a reply to your November 2008 post Ten Reasons Why You Should Ignore Exit Polls. It’s four years later but it would be instructive to review your comments on exit polls to see if you feel the same way about them. I’m still waiting for your response to my open letter regarding your pathetic last-place ranking of pollster John Zogby . I would also be interested in your answers to these twenty-five questions. It would enable readers to gauge your perspectives on election fraud.

Nate, you have it all wrong in your book. The Signal is the 52-42% Democratic lead in the 1988-2008 unadjusted presidential state and national exit polls. The Noise is the media propaganda that the Democrats won by 48-46% as shown in the published adjusted polls. But we all know that it is standard operating procedure to force the exit polls to match the (bogus) recorded vote. The media (that means you) want the public to believe that Systemic Election Fraud is a myth.

Are you asking us to ignore a) the final adjusted exit polls which are ALWAYS forced to match the recorded vote or b) the unadjusted, preliminary state and national exit polls? If it’s (a), then you must believe that election fraud is systemic since the pristine, unadjusted exit polls are always forced to match the recorded vote, even if it is fraudulent. If it’s (b), then you must believe that election fraud is a myth and that the recorded vote reflects actual voter intent (i.e. the true vote). Based on your writings, it must be (b). After reading your “ten reasons”, I came up with ten reasons why you never responded to my posts.

The “experts” whom you cite all have issues. You wrote: “Oh, let me count the ways. Almost all of this, by the way, is lifted from Mark Blumenthal’s outstanding Exit Poll FAQ”

Your first mistake was to believe all those discredited GOP talking points and to cite Mark Blumenthal as your source. You may not be aware that Mark was the original Mystery Pollster and has worked full-time since 2004 to debunk any references to exit polls as indicators of election fraud.

In June 2006, Robert F. Kennedy Jr. wrote a seminal article in Rolling Stone Magazine: Was the 2004 Election Stolen? In a pitiful attempt to debunk RFK, Salon’s Farhad Manjoo wrote Was the 2004 Election Stolen? No. Manjoo’s hit piece contained factual errors and omissions and was fully debunked by a number of analysts. Mark Blumenthal then attemped a defense of Manjoo and smeared RFK in this piece: Is RFK, Jr. Right About Exit Polls?

Here is My Response to the Mystery Pollster’s critique of RFK and an Open Letter to Mark Blumenthal of Pollster.com.

Now I will count the ways. My responses follow each of your statements as to why we should ignore exit polls.

NS
1. Exit polls have a much larger intrinsic margin for error than regular polls. This is because of what are known as cluster sampling techniques. Exit polls are not conducted at all precincts, but only at some fraction thereof. Although these precincts are selected at random and are supposed to be reflective of their states as a whole, this introduces another opportunity for error to occur (say, for instance, that a particular precinct has been canvassed especially heavily by one of the campaigns). This makes the margins for error somewhere between 50-90% higher than they would be for comparable telephone surveys.

RC
Not true. I should stop right here. Exit polls have a much smaller margin of error than pre-election polls. It stands to reason that exit polls are more accurate than pre-election polls because a) those polled know exactly who they voted for and b) in pre-election polls, respondents might change their mind – or not vote.

Regarding cluster samples, perhaps you are unaware that exit pollsters Edison-Mitofsky state in the notes to the National Exit Poll as well as in the NEP Methods Statement that exit poll respondents were randomly-selected and the overall margin of error was 1%. Adding the standard 30% cluster effect raises the calculated 0.86% MoE to 1.1%.

But I understand why you would claim that exit polls are inaccurate since you apparently believe election fraud on voting machines is non-existent. After all, you never discuss the fraud factor. So of course you would conclude that the exit poll discrepancies from the recorded vote indicate that the polls are wrong. The fundamental problem with all your analysis is that you fail to consider the possibility that the polls were close to the truth and the discrepancies from the recorded vote were the result of systematic election fraud. But that is typical of mainstream media pundits. If they discussed the fraud factor, they would be out of a job.

You apparently believe that the final Likely Voter (LV) pre-election polls (which are a subset of all Registered Voters (RV) interviewed) are spot-on because they match the bogus recorded vote. But LV polls always understate Democratic turnout, since the vast majority of voters who fail to pass the Likely Voter Cutoff Model are young, newly registered Democrats. That’s one reason why Democrats average higher in the RV polls than in LVs and the media avoids the RVs in the month prior to the election. Another factor is that telephone polls miss cell-phone users who are young and Democratic. Most important, pre-election polls have been shown to overweight Republicans based on prior bogus recorded votes.

NS
2. Exit polls have consistently overstated the Democratic share of the vote. Many of you will recall this happening in 2004, when leaked exit polls suggested that John Kerry would have a much better day than he actually had. But this phenomenon was hardly unique to 2004. In 2000, for instance, exit polls had Al Gore winning states like Alabama and Georgia (!). If you go back and watch The War Room, you’ll find George Stephanopolous and James Carville gloating over exit polls showing Bill Clinton winning states like Indiana and Texas, which of course he did not win.

RC
There you go again, assuming that the recorded vote was fraud-free. Of course the Democrats always do better in the exit polls than in the recorded vote. But did you ever consider why? Perhaps you are unaware that millions of votes are uncounted in every election and the vast majority are Democratic (over 50% are in minority districts). The U.S. Census reported over 80 million net uncounted votes since 1968. You make the false assumption that the recorded vote is the True Vote. Uncounted votes alone put the lie to that argument, not to mention votes switched at the DREs and central tabulators.

You say Clinton did not win Indiana or Texas. How do you know? Can you provide proof that the voting machines were not tampered with? Perhaps you are unaware that in 1992 there were 9.4 million net uncounted votes, approximately 75% for Clinton. Clinton’s margins were very plausible. The exit polls indicated that he won Indiana by 53-30% (Perot had 16%) and Texas by 43-32% (Perot had 25%). But they were both likely stolen by Bush. Clinton lost Indiana (42.9-36.8%) by 138,000 votes (330,000 uncounted). He lost Texas (40.6-37.1%) by 215,000 (663,000 uncounted). So had all the votes been counted, Clinton would have won both states. Note that we are not even considering vote-switching from Clinton or Perot to Bush, just the uncounted votes.

In 1996, there were 8.7 million net uncounted votes – again, approximately 75% for Clinton. Clinton won the Indiana exit poll by 50-40%, but Dole won the recorded vote by 117,000, 47.1-41.6% (230,000 net uncounted). The Texas exit poll was tied at 46-46%, but Dole won by 280,000 votes, 48.8-43.8% (700,000 net uncounted). Again, had all the votes been counted, Clinton would have likely won both. And this does not include vote switching from Clinton or Perot to Dole, just the uncounted votes.

NS
3. Exit polls were particularly bad in this year’s primaries. They overstated Barack Obama’s performance by an average of about 7 points.

RC
You are apparently unaware of Rush Limbaugh’s “Operation Chaos” in which he advised Republicans to cross over in the Democratic primaries and vote for Hillary Clinton. His objective was to deny Obama the nomination. Obama easily won the all the caucuses in which voters were visually counted.

NS
4. Exit polls challenge the definition of a random sample. Although the exit polls have theoretically established procedures to collect a random sample — essentially, having the interviewer approach every nth person who leaves the polling place — in practice this is hard to execute at a busy polling place, particularly when the pollster may be standing many yards away from the polling place itself because of electioneering laws.

RC
You are apparently unaware that exit pollsters Edison-Mitofsky wrote in the notes to the 2004 National Exit Poll that respondents were randomly selected as they exited the polling booth. What is your definition of a random sample?

NS
5. Democrats may be more likely to participate in exit polls. Related to items #1 and #4 above, Scott Rasmussen has found that Democrats supporters are more likely to agree to participate in exit polls, probably because they are more enthusiastic about this election.

RC
US Count Votes did a comprehensive analysis of the 2004 exit poll discrepancies which disproved the exit pollster’s reluctant Bush responder hypothesis.

You quote a biased GOP pollster who never did an exit poll. There is no evidence that Democrats are more likely to participate. In fact, the historical data shows otherwise. You are resurrecting the reluctant Bush responder (rBr) hypothesis that was disproved by the exit pollster’s own data in each of the 2000, 2004 and 2008 elections. It is also contradicted by a linear regression analysis which showed that response rates were highest in partisan GOP precincts and Red states.

NS
6. Exit polls may have problems calibrating results from early voting. Contrary to the conventional wisdom, exit polls will attempt account for people who voted before Election Day in most (although not all) states by means of a random telephone sample of such voters. However, this requires the polling firms to guess at the ratio of early voters to regular ones, and sometimes they do not guess correctly. In Florida in 2000, for instance, there was a significant underestimation of the absentee vote, which that year was a substantially Republican vote, leading to an overestimation of Al Gore’s share of the vote, and contributing to the infamous miscall of the state.

RC
You are apparently unaware that exit pollsters Edison-Mitofsky claimed that their 2004 precinct design sample was near perfect.

Perhaps you are unaware of the fact that in the 2000 election, nearly 6 million ballots were never counted (a combination of spoiled, absentee and provisional) – and 75-80% were Gore votes – meaning that his True Vote margin was at least 3 million more than his recorded 540,000. And that is why Gore led the state exit poll aggregate by 50-45%.

You are either unaware or choose to ignore the fact that in Florida there were over 180,000 spoiled ballots (113,000 double and triple-punched and 65,000 underpunched) that were never counted – and 75% were Gore votes. You apparently believe the GOP con that the spoiled ballots were due to stupid voters. Why don’t you mention the thousands of Gore absentee ballots that were discarded? Perhaps you are unaware that it has been determined GOP election officials discarded Democratic absentee ballots and included GOP ballots that were filed after the due date. And what about the Palm Beach butterfly ballot in which thousands of Jews were fooled into voting for Buchanan?

If you really believe that Bush won both the national and Florida elections in 2000, then you must also believe that a) the tooth fairy exists, b) global warming is just a hoax and c) the economic meltdown was due to natural supply and demand forces and that the economic forecasting models were at fault. You ignore the strong evidence that the meltdown was due to corrupt global banksters gaming the financial system. And of course, you ignore the election fraudsters that have systematically gamed the computers to miscount votes and prevent millions of eligible citizens from voting. According to you, it is all just noise, never human corruption.

NS
7. Exit polls may also miss late voters. By “late” voters I mean persons who come to their polling place in the last couple of hours of the day, after the exit polls are out of the field. Although there is no clear consensus about which types of voters tend to vote later rather than earlier, this adds another way in which the sample may be nonrandom, particularly in precincts with long lines or extended voting hours.

RC
As a quant, you should ask how was it that Kerry led by 51-48% at 12:22am (13047 respondents) but Bush led at 1:00am at the final (13660) after just 613 additional respondents? It’s simple. The pollsters had to force the National to match the bogus recorded vote (Bush 50.7-48.3%). It was impossible – a total sham. It was Kerry who led the final unadjusted NEP by 51.7-47.0%.

Are you aware that final exit polls are always FORCED to match the recorded vote? The 2004 adjusted final National Exit Poll indicated that 43% (52.6 million) of 2004 voters were returning Bush voters and 37% Gore voters. But Bush only had 50.5 million voters in 2000 – and approximately 2.5 million died. So there could not have been more than 48 million returning Bush voters. If 47 million turned out, there had to be 5.6 million phantom Bush voters. How do you explain that?

In 2008, Obama won the unadjusted National Exit Poll (17836 respondents) by 61-37%. But the poll was forced to match the recorded 52.9-45.6%. Are you aware that Obama had 52.4% of 121 million votes recorded on Election Day and 59.2% of the 10 million recorded later?

NS
8. “Leaked” exit poll results may not be the genuine article. Sometimes, sources like Matt Drudge and Jim Geraghty have gotten their hands on the actual exit polls collected by the network pools. At other times, they may be reporting data from “first-wave” exit polls, which contain extremely small sample sizes and are not calibrated for their demographics. And at other places on the Internet (though likely not from Geraghty and Drudge, who actually have reasonably good track records), you may see numbers that are completely fabricated.

RC
Really? Are these fabricated? You are apparently unaware of the National Exit Poll timeline. Kerry led by 51-48% at 4:00pm (8349 respondents), 9:00pm (11027) and 12:22am (13047). Kerry led at the final 13660 respondents by 51.7-47.0%. But at approximately 1:00am, Kerry responders were flipped to Bush in order to force the poll to match the recorded vote.

NS
9. A high-turnout election may make demographic weighting difficult. Just as regular, telephone polls are having difficulty this cycle estimating turnout demographics — will younger voters and minorities show up in greater numbers? — the same challenges await exit pollsters. Remember, an exit poll is not a definitive record of what happened at the polling place; it is at best a random sampling.

RC
Perhaps you are unaware that high turnout is always good for the Democrats. That’s why the GOP is always trying to suppress the vote. The National Exit Poll indicates that Kerry won 57-62% of new voters and that Obama had 72% of new voters in 2008. But at least you now agree that exit polls are indeed random samples. Glad you corrected point #4.

NS
10. You’ll know the actual results soon enough anyway. Have patience, my friends, and consider yourselves lucky: in France, it is illegal to conduct a poll of any kind within 48 hours of the election. But exit polls are really more trouble than they’re worth, at least as a predictive tool. An independent panel created by CNN in the wake of the Florida disaster in 2000 recommended that the network completely ignore exit polls when calling particular states. I suggest that you do the same.

RC
I suggest that you do your homework. You will surely fail this Election Fraud Quiz. Exit polls are more trouble than they are worth? Yes, it’s true – for those who rig the elections. Perhaps you are unaware that the exit polls were the first indicators that the 2004 election was stolen. Nate, your problem is that you refuse to admit that Election Fraud is systemic – or that it even exists. You want your readers to believe that the recorded vote accurately depicts true voter intent and that the exit polls are always wrong. Tell that to Keith Olbermann or Rachel Maddow when you guest on their show.

In 2008, Obama had a recorded 52.9% share and won by 9.5 million votes. But he had to overcome the 5% fraud factor. You are probably unaware that the unadjusted National Exit poll indicates that he won 61% of 17,836 respondents. Obama had 58.0% in the unadjusted state exit poll weighted aggregate (82,388 respondents) winning by 23 million votes – exactly matching the True Vote Model which used the same adjusted final NEP vote shares.

The Bush/Kerry 46/37% returning voter weights in the adjusted final 2008 NEP implied that there were 12 million more returning Bush than Kerry voters – an impossible 103% turnout of living Bush voters. The True Vote Model calculated a feasible 47/40% Kerry/Bush split. Bush won the bogus recorded vote by just 3 million but Kerry won the True Vote by 10 million.

And you would also surely agree that there could not have been 5 million returning third-party voters indicated by the final 2008 NEP since just 1.2 million were recorded in 2004.

We have the 1988-2008 unadjusted state and national exit polls from the Roper website (nearly 500,000 exit poll respondents). The Democrats led the polls by 52-42%; but just 48-46% in the recorded vote. That’s an awful lot of Reluctant Republican Responders, yes?

Presidential election fraud is consistent and predictable. The unadjusted state and national exit polls have matched the True Vote Model in every election since 1988.

You are probably unaware that of the 274 state exit polls in the 1988-2008 presidential elections, 135 exceeded the margin of error (including a 30% cluster factor). Only 14 would be expected to exceed the MoE at the 95% confidence level. Of the 135, 131 “red-shifted” to the Republican and  just 4 to the Democrat. The probability is E-116. Can you explain it?
P= 0.0000000000 0000000000 0000000000 0000000000 0000000000 0000000000 0000000000 000000000 00000000000 0000000000 000000000 0000001.

Finally, Nate, you need to gain a new perspective on exit polls.

—————————————————-
Track Record: Election Model Forecast; Post-election True Vote Model

2004 Election Model (2-party shares)
Kerry 51.8%, 337 EV (snapshot)
State exit poll aggregate: 51.7%, 337 EV
Recorded Vote: 48.3%, 255 EV
True Vote Model: 53.6%, 364 EV

2008 Election Model
Obama 53.1%, 365.3 EV (simulation mean);
Recorded: 52.9%, 365 EV
State exit poll aggregate: 58.0%, 420 EV
True Vote Model: 58.0%, 420 EV

2012 Election Model
Obama Projected: 51.6% (2-party), 332 EV snapshot; 320.7 expected; 321.6 mean
Adjusted National Exit Poll (recorded): 51.0-47.2%, 332 EV
True Vote Model 56.1%, 391 EV (snapshot); 385 EV (expected)
Unadjusted State Exit Polls: not released
Unadjusted National Exit Poll: not released

 
2 Comments

Posted by on November 17, 2012 in Media, Rebuttals


Tags: , , , , , , , , , , , , , ,

Matrix of Deceit: Election Myths, Logic and Probability of Fraud

Election Fraud: Uncertainty, Logic and Probability

Richard Charnin
Oct. 29, 2012

Everyone thinks about how to go about solve problems. But how can they be sure the methods used to solve them are valid? My new book Matrix of Deceit: Forcing Pre-election and Exit Polls to Match Fraudulent Vote Counts deals with uncertainty in our election systems. How do we know that the votes are counted as cast? If the information we are given is tainted, how do we know? We must distinguish between intuitive and logical reasoning. Decisions must be made where there are multiple solution methods.

Which make the most sense? Which is the most probable? If you flip a coin and it comes up heads five times in a row, is the next flip more likely to be tails? Is a baseball player with a .300 batting average who has not had a base hit in his last 10 at bats due to get one his next time up? In decision making, we always need to consider probabilities.

In mathematics we need unambiguous definitions and rules. In other words, we need logical thinking. Logic is defined as a systematic study of the conditions and procedures required to make valid inferences.

We start with a statement and infer other statements are valid and justified as a consequence of the initial statement. It is important to note that logical inference does not mean the statement is true, only that it is valid. If the starting statement is true, then a logically derived result must also be true.

For example, it is a statement of fact that Bush had 50.5 million recorded votes in 2000. Approximately 2.5 million Bush 2000 voters died prior to the 2004 election, so there could not have been more than 48 million returning Bush voters. But according to the 2004 National Exit Poll, there were 52.6 million returning Bush voters. This is clearly impossible.

Furthermore, since the 2004 National Exit Poll was impossible and adjusted to match the recorded vote, then the recorded vote must also have been impossible. This simple deductive reasoning proves 2004 Election Fraud. But the recorded 2000 vote was also fraudulent – as were all elections before that. None reflected true voter intent. The simple proof: there were 6-10 million uncounted votes in every election prior to 2004. Votes cast exceeded votes recorded by 6-10 million. And 70-80% of the uncounted votes were Democratic.

Each National Exit poll is forced to match the bogus recorded vote based on bogus returning voters from the prior bogus election. It’s a recursive process. The polls assume all elections are fair and accurate. The same returning voter logic applied to the 1988, 1992 and 2008 elections shows that they were also fraudulent; the National Exit Polls were forced to match the recorded vote by indicating there were more returning Bush voters than were alive to vote. The corporate media has never seen fit to explain these recurring impossibilities.

Science is “cumulative”. New developments may refine or extend past knowledge. There is no such thing as a foolproof system. What is needed is a probability-based system for many types of problems. It is the only rational way of thinking.

There is no way to eliminate all risk (error) in a system model (or election poll). The problem is to evaluate risk and measure it based on a probability analysis. Every important problem requires a comparison of the odds. Probability analysis supplements classical logical thinking but does not replace it. In fact, classical logic is required in every step in the development of probability theory.

Election Model Forecast; Post-election True Vote Model

2004 Election Model (2-party shares)
Recorded Vote: 48.3%, 255 EV
Election Model: Kerry 51.8%, 337 EV (snapshot)
State exit poll aggregate: 51.7%, 337 EV
Unadjusted National Exit poll: Kerry 51.7-Bush 47%
True Vote Model: 53.6%, 364 EV

2008 Election Model
Obama 53.1%, 365.3 EV (simulation mean);
Recorded: 52.9%, 365 EV
State unadjusted exit poll aggregate: 58.0%, 420 EV
Unadjusted National Exit Poll: Obama 61.0-McCain 36.2%
True Vote Model: 58.0%, 420 EV

2012 Election Model
Obama Projected: 51.6% (2-party), 332 EV snapshot; 320.7 expected; 321.6 mean
Adjusted National Exit Poll (recorded): 51.0-47.2%, 332 EV
True Vote Model 56.1%, 391 EV (snapshot); 385 EV (expected)
Unadjusted State Exit Polls: not released
Unadjusted National Exit Poll: not released

 
7 Comments

Posted by on October 29, 2012 in Uncategorized


Tags: , , , ,

 
MishTalk

Global Economic Trend Analysis