RSS

Walker vs Warnock- Walker would win a fair election with 53% but Warnock will steal the election with 51%

Richard Charnin 12/6/22

https://docs.google.com/spreadsheets/d/1tDOB0CluCXUWVDcnav6hMgQNIUZ0y_J3UY8oW5U0i4s/edit#gid=0

Turnout Sensitivity Analysis

Turnout Pct Walker Warnock

Democrat 36.0% 12% 88%

Republican 36.0% 95% 5%

Independent 28.0% 50% 50%

Calc 100% 52.5% 47.5%

Race Pct Walker Warnock

White 60.0% 71% 29%

Black 33.0% 20% 80%

Other 7.0% 50% 50%

Calc 100% 52.7% 47.3%

Sensitivity analysis

36% Dem-36% Rep-28% Ind

Walker shares

% Rep 95% % Dem

% Ind 6% 9% 12% 15% 18%

54% 51.5% 52.6% 53.6% 54.7% 55.8%

52% 50.9% 52.0% 53.1% 54.2% 55.2%

50% 50.4% 51.4% 52.5% 53.6% 54.7%

48% 49.8% 50.9% 52.0% 53.0% 54.1%

46% 49.2% 50.3% 51.4% 52.5% 53.6%

Race Sensitivity analysis

60% White-33Black-7Other

Walker shares

% Other 50% %White

% Black 67% 69% 71% 73% 75%

24% 51.6% 52.8% 54.0% 55.2% 56.4%

22% 51.0% 52.2% 53.4% 54.6% 55.8%

20% 50.3% 51.5% 52.7% 53.9% 55.1%

18% 49.6% 50.8% 52.0% 53.2% 54.4%

16% 49.0% 50.2% 51.4% 52.6% 53.8%

#HerschelWalker#DonaldJTrump#elonMusk#kerrlake#SteveBannon#JimFetzer#TuckerCarlson#DanBall

 
1 Comment

Posted by on December 5, 2022 in Uncategorized


2020 Election Unmasked – Statistical Anomalies

ThanQ Patriot https://t.me/KanekoaTheGreat

Video source, Anonymous https://www.bitchute.com/video/WNLxq4A2Oo1z/

1. “President Trump received more votes than any previous incumbent seeking reelection. He got 11 million more votes than in 2016, the third largest rise in support ever for an incumbent.”

2. “Trump’s vote increased so much because, according to exit polls, he performed far better with many key demographic groups. Ninety-five percent of Republicans voted for him.”

3. “He earned the highest share of all minority votes for a Republican since 1960. Trump grew his support among black voters by 50 percent over 2016… Joe Biden’s black support fell well below 90 percent, the level below which Democratic presidential candidates usually lose.”

4. “Trump increased his share of the national Hispanic vote to 35 percent. With 60 percent or less of the national Hispanic vote, it is arithmetically impossible for a Democratic presidential candidate to win Florida, Arizona, Nevada, and New Mexico.”

5. “Bellwether states swung further in Trump’s direction than in 2016. Florida, Ohio and Iowa each defied America’s media polls with huge wins for Trump. Since 1852, only Richard Nixon has lost the electoral college after winning this trio”…

6. “Midwestern states Michigan, Pennsylvania, and Wisconsin always swing in the same direction as Ohio and Iowa, their regional peers. Ohio likewise swings with Florida. Current tallies show that, outside of a few cities, the Rust Belt swung in Trump’s direction.”

7. “Yet, Biden leads in Michigan, Pennsylvania, and Wisconsin because of an apparent avalanche of black votes in Detroit, Philadelphia, and Milwaukee. Biden’s ‘winning’ margin was derived almost entirely from such voters in these cities”…

8. “… as coincidentally his black vote spiked only in exactly the locations necessary to secure victory. He did not receive comparable levels of support among comparable demographic groups in comparable states, which is highly unusual for the presidential victor.”

9. “We are told that Biden won more votes nationally than any presidential candidate in history. But he won a record low of 17 percent of counties; he only won 524 counties, as opposed to the 873 counties Obama won in 2008. Yet, Biden somehow outdid Obama in total votes.”

10. “Victorious presidential candidates, especially challengers, usually have down-ballot coattails; Biden did not. The Republicans held the Senate and enjoyed a ‘red wave’ in the House, where they gained a large number of seats while winning all 27 toss-up contests.”

11. “Trump’s party did not lose a single state legislature and actually made gains at the state level.”

12. “Another anomaly is found in the comparison between the polls and non-polling metrics. The latter include: party registrations trends; candidates’ respective primary votes; candidate enthusiasm; social media followings; broadcast and digital media ratings; online searches”…

 
Leave a comment

Posted by on May 22, 2022 in Uncategorized


Probability that Covid-19 would spread among several dozen leading Democrats and Biden officials

Richard Charnin – 4/28/22

What is the probability P that Covid-19 would spread among several dozen leading Democrats and Biden officials after a dinner hosted by the Gridiron Club, where PROOF OF VACCINE WAS REQUIRED?

P= 1/trillion*trillion*trillion*trillion*trillion

Assume N=100 at dinner, n= 24 infected, R= 2% infection rate, T=1 week= .019 year

P = poisson (n, N*R*T, false)

P=1.70E-58 = (1/trillion}^5

Assuming N=2000, P= 1.38E-27 = 1/trillion^2

NnProb
100241.70E-58
500248.70E-42
1,000241.20E-34
1,500241.67E-30
2,000241.38E-27
5,000241.54E-18

https://www.theguardian.com/us-news/2022/apr/08/covid-19-spreads-democrats-biden-officials?fbclid=IwAR3qV91ScVhVB6Ls6H1BXOZxqtTx5GsKETRotuWfnjvo1_zuyi__jAnIX2I

 
Leave a comment

Posted by on April 28, 2022 in Uncategorized


Major reversal: Why the recent sharp percentage drop in Covid-19 cases compared to the decline in deaths?

Feb. 15, 2022

Richard Charnin

Why the recent sharp percentage drop in Covid-19 cases compared to the decline in deaths?

On Jan. 25, the 7-day moving average of Cov-19 cases was 640,000. On Feb. 15 it dropped 78% to 142,000.

On Jan 25, the 7-day moving average of Cov-19 deaths was 2200. On Feb. 15 it dropped just 9% to 2000.

How many of the latest 7-day cases were already vaxxed? How many were unvaxxed?

How many deaths were of people previously vaxxed? How many were unvaxxed?

How many deaths included comorbidities?

 
Leave a comment

Posted by on February 16, 2022 in Uncategorized


Why is there a rapidly declining Covid-19 mortality rate vs. the sharp rise in cases?

Richard Charnin Jan. 1, 2022

LINKS TO  BLOG POSTS

On Dec.1, 2021, the 7-day average of number of cases was 52,000 and the 7-day average mortality rate (total deaths/total cases) was 1.1%.

As of Dec. 31, the corresponding averages were 367,000 and 0.31%. The number of daily cases has increased by 7X while the number of daily deaths is nearly constant (1100). Did you hear this on CNN, MSNBC or FOX? Of course not. Ask yourself why.

Are the cases inflated by Omicron (which has virtually zero mortality) and/or false positive tests? How many of the deaths were vaccinated? Does the declining death rate reflect herd immunity and/or the use of Ivermectin, Regeneron and HCQ?

This is the biggest con-job in history. The unvaccinated are not spreading Covid. The problem is vaccinated taking boosters with spiked protein affecting their DNA and possibly spreading Covid to the unvaccinated. https://docs.google.com/…/1Jbfznj3c27kKvF7Vpo9pWIe…/edit

 
2 Comments

Posted by on January 1, 2022 in Uncategorized


Probability analysis: 24 Unadjusted state exit polls vs. recorded vote vs. Cyber Symposium PCAPS.

Richard Charnin Nov. 29,2021

LINKS TO  BLOG POSTS

Probability analysis: 24 Unadjusted state exit polls vs. recorded vote vs. Cyber Symposium PCAPS.

The deviations are far beyond the state exit poll margin of error. They cannot be explained as being due to chance. Trust the Cyber symposium votes. The unadjusted exit poll and recorded votes are bogus.

N= number of the 24 states exit polled in which the margin of error was exceeded (only 1-2 would be expected at the 95% confidence level)

Vote discrepancy: n=Number of states; Probability P=poisson (n,0.025*24,false)

Exit vs recorded: n=8; P= 1 in 4.4 million

Cyber vs recorded: n=14; P= 1 in 202 trillion

Exit v Cyber: n=15; P= 1 in 5000 trillion

Exit Poll flip: n=24; P = 1 in 16.8 million; P=binomdist (24,24,0.5,false)

Trump had 44.9% in the 24 state exit poll weighted average and 50.3% in the corresponding Cyber average. The probability of the deviation assuming a 1.5% margin of error is P= 1 in 264 million.

P=normdist ( 0.449,0.503,0.0155/1.96,false) =1/264 million

https://docs.google.com/spreadsheets/d/1yh0YkXBVctdJwt0_XHrpCC6f7K30oEz0Vr13MiU5qT4/edit#gid=584196755

 
Leave a comment

Posted by on November 29, 2021 in Uncategorized


Introducing the 2020 Race Sensitivity Analysis Model

Richard Charnin Nov. 19,2021

LINKS TO  BLOG POSTS

Check out the 2020 election state race analysis model.

https://docs.google.com/spreadsheets/d/1yh0YkXBVctdJwt0_XHrpCC6f7K30oEz0Vr13MiU5qT4/edit#gid=1465733498

Trump’s racial shares are forced to match the Cyber Symposium PCAPS using the 2020 Census state votes for each racial group. The sensitivity analysis consists of 25 scenarios over a range of Trump shares of white and black voters.

For example, to match the AZ Cyber Symposium vote, Trump had 61% of whites, 13% of blacks, 44% of Hispanics, 34% of Asians and 41% of Others and had a 270,000 base case vote margin. The worst case margin is 79,000. The best case is 460,000. Biden “won” the rigged AZ election by 10,500 votes.

Race CensusWhiteBlackHispanicAsianOther
U.S. Share71.0%12.2%10.6%4.5%1.6%
AZ Vote2,385179814107164
AZ Share65.4%4.9%22.3%2.9%4.5%
Trump share61.0%13.0%44.0%34.0%41.0%
Biden share37.0%87.0%55.0%61.0%55.0%
Other share2.0%1.0%1.0%5.0%4.0%
ARIZONATrumpBidenOtherTotalMargin
Cyber votes1,8021,532533,387270
Reported votes1,6621,672533,387-10.5
Cyber share53.2%45.2%1.6%100%8.0%
Reported share49.1%49.4%1.6%100%-0.3%
% HispanicAZTrump% White
44.0%57%59%61%63%65%
% BlackMargin
17%106194283371460
15%99188276365453
13%92181270358447
11%86174263351440
9%79168256345433
Trump
17%50.8%52.1%53.4%54.7%56.0%
15%50.7%52.0%53.3%54.6%55.9%
13%50.6%51.9%53.2%54.5%55.8%
11%50.5%51.8%53.1%54.4%55.7%
9%50.4%51.7%53.0%54.3%55.6%
Biden
17%47.7%46.3%45.0%43.7%42.4%
15%47.8%46.4%45.1%43.8%42.5%
13%47.8%46.5%45.2%43.9%42.6%
11%47.9%46.6%45.3%44.0%42.7%
9%48.0%46.7%45.4%44.1%42.8%
Trump
17%1,7201,7641,8081,8531,897
15%1,7171,7611,8051,8491,894
13%1,7131,7581,8021,8461,890
11%1,7101,7541,7981,8431,887
9%1,7071,7511,7951,8391,884
Biden
17%1,6141,5701,5261,4811,437
15%1,6171,5731,5291,4851,440
13%1,6211,5761,5321,4881,444
11%1,6241,5801,5361,4911,447
9%1,6271,5831,5391,4951,450

 
Leave a comment

Posted by on November 19, 2021 in Uncategorized


2020 Exit Poll probability analysis: reported and Cyber Symposium

Richard Charnin Nov.12, 2021

LINKS TO  BLOG POSTS

Biden won the 24 unadjusted state exit polls by 52.6-44.9% and the national vote by 51.3-46.9%.

Trump won the corresponding 24 state Cyber vote by 50.3-47.9%; The exit poll margin of error was exceeded in15 states .

Probability P = 1 in 64 million that Trump would have 44.9% in the 24 unadjusted state exit poll aggregate (1.55% MoE) and 50.3% in the Cyber vote: P= normdist (.503, .449, 1.55%/1.96, True)

Probability P = 1 in 16.7 million that 24 states would move to Trump in the Cyber vote from the unadjusted exit poll: P= binomdist (24, 24, 0.5, false)

Cyber CyberCyberRecordedDiff
Exit PolledTrumpBidenMarginMarginMargin
24 states50.31%47.89%2.42%-4.45%6.87%
AL66.2%32.4%33.7%24.9%8.8%
AZ53.2%45.2%8.0%-1.1%9.1%
CA38.4%59.4%-20.9%-30.6%9.7%
CO46.0%51.3%-5.3%-15.0%9.7%
FL55.4%43.7%11.7%2.9%8.8%
GA53.4%45.3%8.1%-0.9%8.9%
IA57.2%40.7%16.4%7.3%9.2%
KY66.2%32.0%34.2%25.3%8.9%
ME48.0%49.1%-1.1%-10.7%9.6%
MI52.0%46.5%5.5%-3.6%9.1%
MN49.4%48.3%1.1%-8.4%9.5%
MT61.0%36.4%24.5%15.3%9.2%
NC54.1%44.4%9.6%0.6%9.0%
NH49.4%48.5%0.9%-8.4%9.3%
NV47.6%45.9%1.7%-3.6%5.3%
NY41.9%56.7%-14.8%-24.0%9.2%
OH57.4%41.1%16.3%7.3%9.0%
OR44.4%52.4%-7.9%-17.9%10.0%
PA53.0%45.8%7.2%-1.8%8.9%
SC59.2%39.3%20.0%11.0%8.9%
TX56.2%42.3%13.9%4.9%9.0%
VA48.1%50.0%-1.9%-11.2%9.3%
WA42.8%53.9%-11.1%-21.2%10.1%
WI52.9%45.3%7.6%-1.5%9.1%

Trump margin deviations from exit poll

Exit PollExit PollCyberDiffDiff –Diff >
MoEMarginMarginMarginMoEMoE
US1.55%-6.40%2.42%8.82%7.27%15
AL5.5%14.5%33.7%19.2%13.7%Yes
AZ4.7%-5.6%8.0%9.1%4.3%
CA3.9%-25.0%-20.9%9.7%5.7%Yes
CO4.6%-17.9%-5.3%9.7%5.1%Yes
FL2.5%0.4%11.7%8.8%6.2%Yes
GA2.9%-2.8%8.1%8.9%6.0%Yes
IA3.8%-0.9%16.4%9.2%5.4%Yes
KY4.7%17.1%34.2%8.9%4.2%
ME5.0%-13.9%-1.1%9.6%4.5%
MI3.7%-9.2%5.5%9.1%5.4%Yes
MN3.5%-7.4%1.1%9.5%6.0%Yes
MT5.6%8.1%24.5%9.2%3.5%
NC2.8%-0.9%9.6%9.0%6.2%Yes
NH4.0%-10.1%0.9%9.3%5.2%Yes
NV3.0%-6.2%1.7%5.3%2.2%
NY6.2%-27.2%-14.8%9.2%3.0%
OH2.5%5.3%16.3%9.0%6.5%Yes
OR7.3%-17.5%-7.9%10.0%2.7%
PA3.5%-3.0%7.2%8.9%5.4%Yes
SC4.7%6.2%20.0%8.9%4.2%
TX2.8%6.6%13.9%9.0%6.2%Yes
VA2.8%-11.2%-1.9%9.3%6.5%Yes
WA7.1%-16.7%-11.1%10.1%2.9%
WI3.1%-8.0%7.6%9.1%6.1%Yes
 
Leave a comment

Posted by on November 17, 2021 in Uncategorized


2020 Unadjusted state exit polls vs. recorded votes vs. Cyber Symposium PCAPS vote share

Richard Charnin Nov. 14, 2021

LINKS TO  BLOG POSTS

Unadjusted exit polls have always been adjusted in published final polls to match the recorded vote. The exit pollsters at Edison Research claimed they do this because their polls were wrong; they assume the vote counts were accurate. But the pollsters never considered or noted that election fraud was a major factor in the discrepancies. And the corrupt media and politicians maintain the myth that election fraud is a non-existent conspiracy theory.

But mathematical analysts are not fooled. The unadjusted 2000 and 2004 exit polls were fairly accurate and close to the True Vote. Gore and Kerry won easily. The polls proved to be excellent indicators of election fraud. But starting in 2016, the polls have been rigged to match the bogus popular vote.

Let’s compare the Cyber Symposium PCAP votes to the unadjusted exit polls and recorded votes. In the 24 states polled in 2020, Trump’s weighted average PCAPS vote share was 50.3%. He had a 44.9% unadjusted exit poll share and a 46.2% reported share. Trump’s Cyber shares were higher than the exit poll and reported shares in every state.

Bottom line: Don’t trust unadjusted exit polls. They are no different from biased pre-election polls which are just propaganda to set false expectations and influence the public.

https://docs.google.com/spreadsheets/d/1yh0YkXBVctdJwt0_XHrpCC6f7K30oEz0Vr13MiU5qT4/edit#gid=584196755

https://thebiglie.frankspeech.com/US/compare/index.html

https://tdmsresearch.com/

 
Leave a comment

Posted by on November 14, 2021 in Uncategorized


Pennsylvania 2020 fraud: Exit poll and Cyber Symposium

Richard Charnin Nov. 11, 2021

LINKS TO  BLOG POSTS

Trump won the final Pennsylvania Exit Poll Race category by 10,000 votes (even though it grossly understated his shares of whites, blacks and Hispanics). Biden won the Party-ID category by 103,000 (understating Trump’s shares of Republicans and Independents). The Dems rigged the election and Biden “won” PA by 81,000 votes.

But Trump won PA in a 495,000 vote landslide according to the Cyber Symposium (PCAPS). I used Census race weights and adjusted the vote shares to match the Cyber vote.

PA Exit PollRacePctTrumpBidenOther
White81%57%42%1%
Black11%7%92%1%
Hispanic5%27%69%4%
Asian1%34%61%5%
Other2%41%55%4%Margin
Calc6,91549.5%49.3%1.2%0.2%
Calc6,9153,3413,3318410
Reported6,91548.9%50.0%1.1%-1.1%
Reported6,9153,3783,45879-80
PA CyberCensusPctTrumpBidenOther
White5,63483.4%59%39%2%
Black69410.3%14%84%2%
Hispanic2704.0%38%58%4%
Asian841.2%34%61%5%
Other741.1%41%55%4%Margin
Match6,756100.0%53.0%45.8%2.1%8.2%
Match6,7563,5833,029145554
Cyber6,91553.0%45.9%1.1%7.1%
Cyber6,9153,6653,17179494
PA -Party IDPctBidenTrumpOtherMargin
Dem40%92%7%1%1%
Rep41%8%91%1%0%
Ind19%52%44%4%5%
Calc100%50.0%48.5%1.5%-1.5%
Calc6,9153,4553,352109-103
Recorded100%50.0%48.9%1.1%-1.1%
Recorded6,9153,4583,37879-80

https://publicinterestlegal.org/wp-content/uploads/2021/09/Mail-Voting-2012_2020-1P-PA.pdf?fbclid=IwAR1hxnNLzIFMVjmz-SCoAs7k22XGy21t_HB2WNj3RyXod0i78BfNG3Y23Zg

https://www.cnn.com/election/2020/exit-polls/president/pennsylvania

https://docs.google.com/spreadsheets/d/1yh0YkXBVctdJwt0_XHrpCC6f7K30oEz0Vr13MiU5qT4/edit#gid=639160994

https://thebiglie.frankspeech.com/US/compare/index.html

 
1 Comment

Posted by on November 11, 2021 in Uncategorized


Cyber Symposium and 2020 RACE state vote census refute reported exit polls/votes

Richard Charnin Nov.6, 2021

LINKS TO  BLOG POSTS

The Cyber Symposium state results and the 2020 RACE vote census refute the bogus recorded votes of 24 state race exit polls and 26 other states. The race vote shares are forced to match the Cyber margins.

Most of the fraud was in White vote shares , but also in shares of Blacks and Hispanics. Note the difference in the state reported vote margin and Cyber margin.

View all Cyber Symposium stats, Census race breakdowns and bogus reported/exit poll vote tables.

National Exit Poll – forced to match reported vote

US Exit PollPctTrumpBidenOtherMargin
White67%58%41%1%
Black13%12%87%1%
Hispanic13%32%65%3%
Asian4%34%61%5%
Other3%41%55%4%
Calc100%47.17%51.32%1.51%-4.15%
Reported158,38446.86%51.31%1.83%-4.45%
Reported158,38474,21781,2692,898-7,052

National vote (adjust Trump white vote share to match Cyber)

US (adj)CensusPctTrumpBidenOtherMargin
White109,83071.0%62%37%1%
Black18,92212.2%12%87%1%
Hispanic16,45910.6%32%65%3%
Asian6,8814.5%34%61%5%
Other2,5351.6%41%55%4%
Calc154,627100%51.10%47.46%1.44%3.64%
Cyber158,38350.98%47.19%1.83%3.79%
Cyber158,38480,74474,7402,9006,004
AZExit PollTrumpBidenOtherMargin
White74%52%46%2%
Black2%12%87%1%n/a
Hispanic19%37%61%2%
Asian2%34%61%5%n/a
Other3%41%55%4%n/a
Calc3,38747.7%50.2%2.1%-2.5%
Calc3,3871,6141,70271-87
Reported3,38749.1%49.4%1.6%-0.3%
Reported3,3871,6621,67253-10
AZ CyberCensusPctTrumpBidenOtherMargin
White2,38565.4%61%37%2%
Black1794.9%12%87%1%
Hispanic81422.3%44%55%1%
Asian1072.9%34%61%5%
Other1644.5%41%55%4%
Match3,649100.0%53.1%45.0%1.9%8.1%
Match3,6491,9381,64170297
Cyber3,38753.2%45.2%1.6%8.0%
Cyber3,3871,8021,53253270
FLExit PollPctTrumpBidenOtherMargin
White6,86262%62%37%1%
Black1,54914%10%89%1%
Hispanic2,10319%46%53%1%
Asian1111%34%61%5%na
Other4434%44%55%1%
Calc11,067100%50.7%48.3%3.3%2.4%
Calc11,0674,9264,6931,449233
Reported11,06751.2%47.9%0.9%3.3%
Reported11,0675,6695,297102372
FL CyberCensusPctTrumpBidenOtherMargin
White6,26064.4%66%33%1%
Black1,37514.1%14%85%1%
Hispanic1,78918.4%53%46%1%
Asian2572.6%34%61%5%
Other390.4%44%55%1%
Match9,720100.0%55.3%43.6%1.1%11.7%
Match9,7205,3774,2361071,141
Cyber11,06755.3%43.7%1.2%11.6%
Cyber11,0676,1224,8321131,290

GAExit PollPctTrumpBidenOtherMargin
White3,05061%69%30%1%
Black1,45029%11%88%1%
Hispanic3507%37%62%1%
Asian501%34%61%5%na
Other1002%38%58%4%
Calc5,000100.0%49.0%49.9%1.1%-1.0%
Calc5,0002,3942,441165.7-47
Reported5,00049.2%49.5%1.3%-0.3%
Reported5,0002,4622,47464-12
GA CyberCensusPctTrumpBidenOtherMargin
White2,94760.3%78%21%1%
Black1,60832.9%12%87%1%
Hispanic1783.6%37%58%5%
Asian1162.4%34%61%5%
Other390.8%38%58%4%
Match4,888100.0%53.4%45.3%1.3%8.1%
Match4,8882,6122,21461.8397
Cyber5,00053.4%45.3%1.3%8.1%
Cyber5,0002,6692,26665.0403

MIExit PollTrumpBidenOtherMargin
White81%55%44%2%
Black12%7%92%1%
Hispanic3%44%55%1%
Asian1%34%61%5%na
Other3%41%55%4%na
Calc5,53948.3%50.6%1.9%-2.3%
Calc5,5392,6742,80263-128
Reported5,53947.8%50.6%1.54%-2.8%
Reported5,5392,6502,80485-154

MI CyberCensusPctTrumpBidenOtherMargin
White3,99780.0%59%39%2%
Black62812.6%14%86%0%
Hispanic1653.3%44%55%1%
Asian651.3%34%61%5%
Other1392.8%41%55%4%
Match4,994100.0%52.0%46.2%1.8%5.8%
Match4,9942,5982,30690292
Cyber5,53952.0%46.5%1.7%5.5%
Cyber5,5392,8792,57585304

MNExit PollTrumpBidenOtherMargin
White81%47%51%2%
Black9%21%77%2%
Hispanic4%38%60%2%
Asian3%34%61%5%na
Other3%41%55%4%na
Calc3,27743.7%54.1%2.2%-10.4%
Calc3,2771,4101,745122-335
Reported3,27745.3%52.4%2.3%-7.1%
Reported3,2771,4841,71776-233

MN CyberCensusPctTrumpBidenOtherMargin
White2,84088.1%53%46%1%
Black1304.0%15%84%1%
Hispanic983.0%38%60%2%
Asian742.3%34%61%5%
Other832.6%41%55%4%
Match3,225100.0%50.3%48.5%1.2%1.8%
Match3,2251,6211,5653956
Cyber3,27750.2%49.1%0.7%1.1%
Cyber3,2771,6191,5827637

NVExit PollTrumpBidenOtherMargin
White65%56%43%1%
Black7%18%80%2%
Hispanic17%35%61%4%
Asian5%35%64%1%
Other6%54%42%4%
Calc1,40548.6%49.6%1.8%-1.0%
Calc1,40565767124-14
Reported1,40547.7%50.1%2.3%-2.4%
Reported1,40567070332-34

NV CyberCensusPctTrumpBidenOtherMargin
White82761.2%61%36%3%
Black13610.1%19%80%1%
Hispanic23917.7%47%52%1%
Asian1349.9%35%64%1%
Other151.1%54%44%2%
Match1,351100.0%51.6%46.1%2.3%5.5%
Match1,3516976233174
Cyber1,40551.8%46.0%2.3%5.8%
Cyber1,4057286463182

PAExit PollTrumpBidenOtherMargin
White81%57%42%1%
Black11%7%92%1%
Hispanic5%27%69%4%
Asian1%34%61%5%na
Other2%41%55%4%na
Calc6,91549.5%49.3%1.3%0.15%
Calc6,9153,3413,3318410
Reported6,91548.84%50.01%1.15%-1.16%
Reported6,9153,3783,45879-81
PA CyberCensusPctTrumpBidenOtherMargin
White5,63483.4%59%40%2%
Black69410.3%14%84%2%
Hispanic2704.0%38%58%4%
Asian841.2%34%61%5%
Other741.1%41%55%4%
Match6,756100.0%53.0%45.7%1.3%7.3%
Match6,7563,5833,085145498
Cyber6,91553.0%45.9%1.1%7.1%
Cyber6,9153,6653,17179494

TXExit PollTrumpBidenOtherMargin
White60%66%33%1%
Black12%9%90%1%
Hispanic23%41%58%1%
Asian3%30%63%7%
Other2%56%42%2%
Calc11,31552.13%46.67%1.20%5.46%
Calc11,3155,8995,281136618
Reported11,31552.06%46.48%1.46%5.58%
Reported11,3155,8905,259166631

TX CyberCensusPctTrumpBidenOtherMargin
White6,78557.1%67%24%9%
Black1,52112.8%14%85%1%
Hispanic2,97225.0%47%51%2%
Asian4824.1%30%63%7%
Other1141.0%56%42%2%
Match11,874100.0%53.60%40.33%6.07%13.27%
Match11,8746,3644,7897211,576
Cyber11,31553.55%40.34%6.11%13.21%
Cyber11,3156,3594,7901661,569
WIExit PollTrumpBidenOtherMargin
White86%52%46%2%
Black6%8%92%0%
Hispanic4%37%60%3%
Asian1%34%61%5%na
Other2%41%55%4%na
Calc3,25347.8%49.2%2.0%-1.6%
Calc3,2531,5561,60064-44
Reported3,29848.8%49.4%1.7%-1.6%
Reported3,2981,6101,63157-21

WI CyberCensusPctTrumpBidenOtherMargin
White2,91489.6%56%43%1%
Black1143.5%13%86%1%
Hispanic1013.1%37%60%3%
Asian441.4%34%61%5%
Other802.5%41%55%4%
Match3,253100.0%53.2%45.6%1.2%7.6%
Match3,2531,7321,48339249
Cyber3,29852.9%45.3%1.7%7.6%
Cyber3,2981,7461,49557251

https://docs.google.com/spreadsheets/d/1yh0YkXBVctdJwt0_XHrpCC6f7K30oEz0Vr13MiU5qT4/

 
Leave a comment

Posted by on November 5, 2021 in Uncategorized


Colorado 2020 Election: Indications of Fraud

Colorado 2020 election: Math Indications of fraud

Richard Charnin Oct. 27, 2021

LINKS TO  BLOG POSTS

The CO Exit Poll was forced to match the recorded vote Biden (55.4-41.9%). How did Biden get 57% of whites in CO if Trump had 58% nationally? For the poll to match the recorded vote, CO Exit Poll vote shares had to be INCREASED for Trump! The sensitivity analysis below shows that Trump would have won CO if he had just 51% of the white vote.

Note that the Census indicates 2,827,000 voted in CO compared to the 3,256,000 reported. Could there have been an estimated 430,000 STUFFED BALLOTS? Where is the CO Forensic audit?

National Exit Poll – adjusted to match the total U.S. reported vote

NEPPctTrumpBidenOther
White67%58%41%1%
Black13%12%87%1%
Hispanic13%32%65%3%
Asian4%34%61%5%
Other3%41%55%4%
Reported100%47.17%51.32%1.51%

CO Exit Poll – adjusted to match the CO reported vote. Biden wins by 440,000 votes

COPctTrumpBidenOther
White79%41%57%2%
Black3%16%80%4%
Hispanic12%49%47%4%
Asian2%53%42%5%
Other4%53%38%9%
Total100%41.9%55.4%2.7%
Reported100%41.9%55.4%2.7%
Votes3,2561,3641,80488

National Exit Poll vote shares and CO Census voting weights. Trump wins by 212,000 votes.

CO CensusCensusNEPNEPNEP
AdjustVotesPctTrumpBidenOther
White 2,31681.6%58%41%1%
Black963.4%12%87%1%
Hispanic31511.1%32%65%3%
Asian501.8%34%61%5%
Other602.1%41%55%4%
Total2,837100.0%53.0%45.5%1.5%
Reported3,256100.0%41.9%55.4%2.7%
Census Votes28371503129144

Sensitivity Analysis – Trump wins by 31,000 with 51% of the white vote

% HispanicCOTrump% White
43%43%45%47%49%51%
% BlackMargin
29%-377-271-164-5848
27%-381-275-169-6244
25%-386-280-173-6740
23%-390-284-178-7135
21%-395-288-182-7631
Trump
29%42.9%44.5%46.1%47.8%49.4%
27%42.8%44.4%46.1%47.7%49.3%
25%42.7%44.4%46.0%47.6%49.3%
23%42.7%44.3%45.9%47.6%49.2%
21%42.6%44.2%45.9%47.5%49.1%
Biden
29%54.4%52.8%51.2%49.5%47.9%
27%54.5%52.9%51.2%49.6%48.0%
25%54.6%52.9%51.3%49.7%48.0%
23%54.6%53.0%51.4%49.7%48.1%
21%54.7%53.1%51.4%49.8%48.2%
Votes Trump
29%1,3961,4491,5021,5561,609
27%1,3941,4471,5001,5531,606
25%1,3921,4451,4981,5511,604
23%1,3891,4431,4961,5491,602
21%1,3871,4401,4941,5471,600
VotesBiden
29%1,7731,7201,6671,6131,560
27%1,7751,7221,6691,6161,563
25%1,7771,7241,6711,6181,565
23%1,7801,7261,6731,6201,567
21%1,7821,7291,6751,6221,569
2020 Census Table 4b. Reported Voting and Registration, by Sex, Race and Hispanic Origin, for States: November 2020

https://docs.google.com/spreadsheets/d/1yh0YkXBVctdJwt0_XHrpCC6f7K30oEz0Vr13MiU5qT4/edit#gid=1267983589

https://www.cnn.com/election/2020/exit-polls/president/colorado

https://www.cnn.com/election/2020/results/president
https://www.cnn.com/election/2020/exit-polls/president/national-results

 
2 Comments

Posted by on October 27, 2021 in Uncategorized


CNN / FOX Biden Approval: More Fake math

Richard Charnin Oct. 19, 2021

LINKS TO  BLOG POSTS

This will show proof that CNN and Fox News think you’re stupid.

On Sept. 7, CNN had 49% Biden approval. On Oct. 13, after the sharp decline in Biden’s overall approval, CNN showed 50%! On Sept. 15, Fox showed 50%. On Sept. 11, The Hill had 54%. WTF!

Reuters/Ipsos (Oct. 14) is another establishment poll which is always biased. It has Biden at 47%, with 15% approval from Republicans! Compare it to Quinnipiac’s 3%.

The Oct. 18 Quinnipiac poll has Biden approval at 37% (see below).

Civiqs is an online national and state demographic survey. Biden is at 39% (see trend below).

We have the latest CNN internals. As usual, CNN underweighted the percent of Republican respondents and manipulated the poll shares to derive the bogus approval rating. All unbiased (and biased) observers should know by now that it is standard operating procedure for the media to rig pre-election and exit polls for the Democrats. For those that still don’t see this: wake up and do the math!

The following steps show how CNN may have derived 50% Biden approval, given the average current 43% Biden approval rating.

Step 1: Start with the consensus Biden approval using 2020 National Exit Poll Party-ID

Actual %NEP party-IDApproveDisapprove
Dem378614
Ind263565
Rep37595
Total10042.857.2

Step 2: Adjust Party-ID

Adjust 1CNN Party-IDApproveDisapprove
Dem358614
Ind363565
Rep29595
Total10044.255.8

Step 3: Adjust approval shares to derive bogus 50% CNN approval.

Adjust 2: Final CNNParty-IDApproveDisapprove
Dem358812
Ind364555
Rep291288
Total10050.549.5
QuinnipiacParty-IDApproveDisapprove
Dem297911
Ind472856
Rep24395
Total10036.852.3

Reuters/IpsosSamplePctApproval
Dem41845.7%81%
Rep39843.5%15%
Ind9810.7%34%
Total914100.0%47.2%

CNN (Oct. 17) http://cdn.cnn.com/cnn/2021/images/10/13/rel6a.-.biden.infrastructure.economy.pdf (page 11)

Reuters/Ipsos (Oct. 14) https://www.ipsos.com/sites/default/files/ct/news/documents/2021-10/2021%20Ipsos%20Tracking%20-%20Core%20Political%20Presidential%20Approval%20Tracker%2010%2014%202021.pdf

Quinnipiac (Oct.18) https://poll.qu.edu/poll-release?releaseid=3825

https://civiqs.com/results/approve_president_biden?uncertainty=true&annotations=true&zoomIn=true

Real Clear Politics Biden approval trend https://www.realclearpolitics.com/epolls/other/president-biden-job-approval-7320.html

 
Leave a comment

Posted by on October 19, 2021 in Uncategorized


Differences between Census and reported state votes (net stuffed and lost ballots) vs. the Census state margin of error

Richard Charnin Oct.17, 2021

LINKS TO  BLOG POSTS

If a state’s Census votes are LESS than recorded, assume the difference is due to NET STUFFED ballots. If the Census votes are GREATER than recorded, assume the difference is due to NET LOST/DISCARDED ballots. In the US, there were 3.7 million net stuffed ballots (5.9 million net stuffed in 33 states and 2.2 million net lost in18 states).

Note that if the Census vote is close to the Reported vote in a state (i.e. the net absolute difference is less than 2%), then we can assume that the number of stuffed ballots is close to the number of lost/discarded ballots.

These states had the most net stuffed ballots (Diff). Note that the net differences exceeded the margin of error, therefore there is a virtual ZERO probability that the discrepancies were due to chance.

Stuffed ballots (net)CensusRecordedDiffDiff %MoE %
US (000)154,628158,3843,7562.4%0.4
Florida9,72011,0671,34712.2%1.6
North Carolina4,7805,52574513.5%2.3
California16,89317,5016083.5%1.2
Michigan4,9945,5395459.8%2.2
Colorado2,8373,25742012.9%3
Massachusetts3,2493,63138210.5%2.7
Washington3,8544,0882345.7%2.5
Virginia4,2754,4611864.2%2.4
Pennsylvania6,7566,9151592.3%1.9
Connecticut1,6811,8241437.9%3.4
Georgia4,8885,0001122.2%2.3

These states had the most net lost/discarded ballots. Each net abs (Diff) exceeded the Census margin of error, a virtual ZERO probability that the discrepancies were due to chance.

Lost ballots (net)CensusRecordedDiffDiff % MoE %
US (000)154,628158,3843,7562.4%0.4
Texas11,87411,315-559-4.9%1.5
Tennessee3,3463,054-292-9.6%2.7
Arizona3,6493,387-262-7.7%2.6
Mississippi1,5311,314-217-16.5%3.2
Ohio6,1285,922-206-3.5%2
Maryland3,1663,037-129-4.2%2.8

View all states here: https://docs.google.com/spreadsheets/d/1yh0YkXBVctdJwt0_XHrpCC6f7K30oEz0Vr13MiU5qT4/edit#gid=1244287493


https://www2.census.gov/programs-surveys/cps/techdocs/cpsnov20.pdf

 
2 Comments

Posted by on October 17, 2021 in Uncategorized


Discrepancies between the 2020 Census vs. the Reported Vote – Race Demographic

Discrepancies between the the 2020 Census vs. Reported vote – Race

Richard Charnin Oct. 16, 2021

LINKS TO  BLOG POSTS

The 2020 census reported 154.628 million voted. The margin of error was 0.4%. There was a 90% level of confidence that there were 154.009m-155.247m votes (+/- 618,520 votes from the Census).

There were 158.38m recorded votes, exceeding the census by 3.8 million, far above the 618,520 Census margin of error. Where did those excess votes come from?

Also, according to the Census, white voters comprised 71% of the vote. According to the NEP, they were 67% of the electorate and Trump had 58% of whites. Applying the 3.8 million (4%) increase of white voters in the census over the NEP reduces Biden’s margin by more than half (4.46% to 2.04%). But it does not take into account forced reduction in Trump’s true vote shares required to match the proven fraudulent recorded vote.

As always, the NEP forced a near perfect match to the reported vote; the anomalies understate Trump’s True vote. He won in a landslide. It will become obvious when battleground states have forensic audits.

NEPNEPTrumpBidenOther
White67%58%41%1%
Black13%12%87%1%
Latino13%32%65%3%
Asian4%34%61%5%
Other3%41%55%4%
Calc100%47.17%51.32%1.44%
Recorded100%46.86%51.31%1.83%
Diff0.31%0.01%-0.39%

NEP (adj)CensusTrumpBidenOther
White71.0%61%38%1%
Black12.2%13%86%1%
Latino10.6%38%59%3%
Asian4.5%38%57%5%
Other1.6%38%58%4%
Adjusted100%51.28%47.28%1.44%
Census Votes154,62879,28973,1122,227
Recorded100%46.86%51.32%1.81%
Votes158,38074,22481,2852,803

Sensitivity Analysis

Trump%Trump %White
Non-white58%61%62%
35%51.3%53.5%54.2%
30%49.9%52.0%52.7%
27%49.0%51.15%51.9%
22%47.6%49.7%50.4%
17%46.1%48.3%49.0%
Biden
35%47.4%45.2%44.5%
30%48.8%46.7%46.0%
27%49.7%47.56%46.9%
22%51.1%49.0%48.3%
17%52.6%50.5%49.7%
Trump margin
35%6,12812,71714,914
30%1,6488,23810,434
27%-1,0405,5507,746
22%-5,5201,0703,267
17%-10,000-3,410-1,213

View the calculations: https://docs.google.com/spreadsheets/d/1yh0YkXBVctdJwt0_XHrpCC6f7K30oEz0Vr13MiU5qT4/edit?fbclid=IwAR2VNV1CK37ny9HIlJyH4BcBbw9TK4esAh0-7OcDVFWDRDDNUNTRcV_kW-E#gid=1267983589

 
2 Comments

Posted by on October 16, 2021 in Uncategorized


Math Analysis Posts: Elections, JFK , Conspiracies

Richard Charnin – Oct 12, 2021

LINKS TO  BLOG POSTS

Conspiracies

Mathematical Probabilities https://richardcharnin.wordpress.com/…/conspiracy…/

Drills staged during Terror attacks: Coincidence or Conspiracy? https://richardcharnin.wordpress.com/2015/12/13/14991/

Seth Rich: Probability of a conspiracy: https://richardcharnin.wordpress.com/2017/05/20/quick-mortality-probability-calculator/

Election Analysis

2020 Election Model https://richardcharnin.wordpress.com/…/2020-election…/

Probability analysis of Biden winning 5 battleground states based on Election Day votes https://richardcharnin.wordpress.com/…/confirming-the…/https://docs.google.com/…/1yh0YkXBVctdJwt0…/edit…

2018 Midterms probability analysis indicates fraud: https://richardcharnin.wordpress.com/2018/11/11/2018-house-probability-analysis-indicates-fraud/

2017 Alabama Senate election: https://richardcharnin.wordpress.com/2017/12/14/2017-alabama-true-vote-75-turnout-of-of-clinton-voters-but-only-45-of-trump-voters/

Trump 2016 Landslide? Do the Math: https://richardcharnin.wordpress.com/2019/10/13/trump-2016-landslide-do-the-math/

Institutional Investor article: https://www.institutionalinvestor.com/article/b150zrw4p2284m/technology-raises-election-fraud-issues-but-may-hold-solutions-too

The Law of Large Numbers and the Central Limit Theorem: A Polling Simulation https://richardcharnin.wordpress.com/…/election-fraud…/

2020 Election Analyzer https://cleverjourneys.com/…/accurate-election-fraud…/

2004 Election Monte Carlo simulation http://www.richardcharnin.com/ElectionModel.htm

Recursive True Vote Model (1968-2008) http://richardcharnin.com/RecursiveTrueVoteModel.htm

Three exit poll response optimization models http://www.richardcharnin.com/ExitPollResponseOptimizatio…

Correlation analysis: Vote swing vs. red shift http://www.richardcharnin.com/SwingVsRedshift1992to2004.htm

JFK Conspiracy

Probability calculations for nine unnatural death categories https://docs.google.com/…/1FmXudDf6pqisxq…/edit…

Probability calculations- Data and Methodology https://richardcharnin.wordpress.com/…/jfk-witness…/

Unnatural Witness Deaths: A Statistical Summary https://richardcharnin.wordpress.com/…/jfk-sensitivity…/

Graphical Proof of a Conspiracy https://richardcharnin.wordpress.com/…/jfk-witness…/

 
Leave a comment

Posted by on October 12, 2021 in Uncategorized


Unadjusted Exit Polls, Reported votes, Cyber Symposium PCAPS, Election Model

Richard Charnin Oct. 8, 2021

LINKS TO  BLOG POSTS

In 1992-2012, exit pollsters at Edison Research conducted unadjusted exit polls that were fairly accurate and close to the True Vote. But they always adjust (force) the unadjusted polls to match the reported vote. Clinton, Gore, Kerry and Obama all won the state and national unadjusted exit polls. But since the 2000 and 2004 elections were stolen, the polls were forced to match the bogus reported votes.

Edison Research always forces exit polls to closely match the fraudulent reported vote. ER never justifies this practice; it is standard operating procedure. ER implicitly assumes that Election Fraud is ZERO in every election. ER never discloses the actual precinct votes; there is no way of checking the actual response of voters in any demographic category as they are all forced to match the national reported vote.

In 2016, Hillary Clinton was the establishment candidate. Pre-election and unadjusted exit polls predicted a Clinton landslide but the polls were inflated to favor HRC. Once again, the unadjusted exit polls were adjusted to match the bogus reported vote. To this day, Clinton promotes the myth that she won 2.8 million more votes than Trump. This was a precursor to 2020. Trump won the popular vote in 2016 and 2020.

From TDMS Research: “Either the exit polls and pre-election polls have been improperly conducted or the vote counts are correct”. https://tdmsresearch.com/2016/11/10/2016-presidential-election-table/ Massive evidence of 2020 election fraud proves that the polls have been improperly conducted.

In 2020, the establishment and DNC knew that Trump would win a fair vote in a landslide against Biden. Once again, pre-election and unadjusted exit polls inflated Biden’s national and state vote shares. The election fraud was massive.  Biden won the bogus popular vote by 81-74 million, even though Trump was highly popular and drew massive crowds while Biden stayed in his basement. Post-election analysis indicates that Trump won in 2020 by approximately 12 million True votes. 

The Mainstream Media, DNC, politicians and RINOs are fighting like hell to mislead the public, claiming the election was perfectly accurate with ZERO fraud. They are determined to prevent forensic analysis of the presidential election in every state. They maintain that Biden won the Maricopa recount but ignore 300,000 illegal ballots- the vast majority went to Biden while thousands of Trump ballots are missing.  They think the American people are stupid and don’t know the difference between a vote recount (which includes fraudulent ballots) and a forensic analysis (which discards fraudulent ballots).

The following table compares 24 state unadjusted exit polls, corresponding reported votes, Cyber Symposium PCAP results and the Election Model.

https://thebiglie.frankspeech.com/US/compare/index.html

2020UnadjReportCyberModel
AvgTrumpBidenTrumpBidenTrumpBidenTrumpBiden
Wtd44.9%52.6%46.2%53.0%50.3%47.9%53.9%44.9%
Unw45.9%51.1%48.3%50.8%52.2%45.7%55.8%43.0%
AL55.8%41.3%62.0%37.1%66.2%32.4%62.6%36.5%
AZ45.0%50.6%49.1%50.2%53.2%45.2%55.5%43.3%
CA36.5%61.5%34.3%64.9%38.4%59.4%47.6%51.0%
CO39.1%57.0%41.9%56.9%46.0%51.3%55.6%43.2%
FL49.3%48.9%51.2%48.3%55.4%43.7%54.9%43.9%
GA47.4%50.2%49.2%50.1%53.4%45.3%55.9%43.0%
IA48.3%49.2%53.1%45.8%57.2%40.7%57.8%41.1%
KY57.6%40.5%62.1%36.8%66.2%32.0%59.3%39.7%
ME40.6%54.5%44.0%54.7%48.0%49.1%53.7%45.0%
MI44.9%54.1%47.8%51.4%52.0%46.5%53.3%45.4%
MN45.1%52.5%45.3%53.6%49.4%48.3%53.4%45.4%
MT50.9%42.8%56.9%41.6%61.0%36.4%62.2%36.8%
NC48.1%49.0%49.9%49.3%54.1%44.4%54.7%44.1%
NH43.7%53.8%45.4%53.8%49.4%48.5%57.2%41.7%
NV43.9%50.1%47.7%51.2%47.6%45.9%56.0%42.8%
NY35.4%62.6%37.8%61.7%41.9%56.7%46.5%52.2%
OH51.7%46.4%53.3%45.9%57.4%41.1%57.5%41.4%
OR39.0%56.5%40.4%58.3%44.4%52.4%62.8%36.2%
PA47.5%50.5%48.8%50.6%53.0%45.8%54.5%44.5%
SC52.2%46.0%55.1%44.1%59.2%39.3%60.4%38.4%
TX51.1%44.5%52.1%47.2%56.2%42.3%56.9%41.7%
VA43.9%55.1%44.0%55.2%48.1%50.0%55.2%43.6%
WA39.7%56.4%38.8%59.9%42.8%53.9%51.1%47.6%
WI45.0%53.0%48.8%50.3%52.9%45.3%54.4%44.3%

2020 Unadjusted exit polls https://docs.google.com/spreadsheets/d/1RDJG6yYbDDEY9fXQdBkKRd7uWoKp1bszLsDhuEFpk04/edit#gid=2007753166

2016 Unadjusted exit poll, Final exit poll (reported vote) and True vote https://docs.google.com/spreadsheets/d/1EWaKPDUolqbN7_od8sSTNMRObfUidlVPRBxeyyirbLM/edit#gid=1309991071

1988-2016 Recorded vote, unadjusted state exit polls, unadjusted national exit polls, True Vote Model https://docs.google.com/spreadsheets/d/1EWaKPDUolqbN7_od8sSTNMRObfUidlVPRBxeyyirbLM/edit#gid=13099910711988-2016

Footprints of Systemic Election Fraud: 1988-2008 Exit Poll Discrepancies https://richardcharnin.wordpress.com/2011/09/16/footprints-of-systemic-election-fraud-1988-2004-state-exit-poll-discrepancies/

 
Leave a comment

Posted by on October 8, 2021 in Uncategorized


2016-2020 exit poll analysis

Richard Charnin – Oct. 3, 2021

LINKS TO  BLOG POSTS

2016-2020 exit poll analysis. This spreadsheet provides an analysis of the 2016 and 2020 national and battleground state exit polls. Exit polls are always forced to match a bogus recorded vote.

One way to estimate the true vote is to view the effects of changes in vote shares in the Party-ID demographic. This is accomplished with a sensitivity analysis table matrix of 25 scenarios by adjusting the recorded vote shares in 1-2% increments. Trump’s share of Republicans is assumed constant in all 25 scenarios.

View the range of vote shares, and vote margins in each of 25 scenarios. The recorded vote for 2016 and 2020 is assumed to be the worst case scenario and is located in the lower-left cell of the matrix table. The base case scenario is in the central cell.

The best case scenario is in the upper right cell. Also included for each state is the 2020 Election Model.

https://docs.google.com/spreadsheets/d/1RDJG6yYbDDEY9fXQdBkKRd7uWoKp1bszLsDhuEFpk04/edit?fbclid=IwAR3d8GAvK9Aj8wckjoLiAZK2TFHxYKtAskvLiwlzhpYw-JEg3ljKPTTO4Cc#gid=0

https://www.cnn.com/election/2016/results/exit-polls/national/president
https://www.cnn.com/election/2020/exit-polls/president/national-results
https://www.cnn.com/election/2020/results/president

2016 NEPParty-IDClintonTrumpOtherMargin
Dem36%89%8%3%-81%
Rep33%8%88%4%80%
Ind31%42%46%12%4%
Share100%47.70%46.18%6.12%-1.52%
Recorded100%48.25%46.24%5.51%-2.00%
Votes (mil)136.2265.7262.997.51-2.73
2020 NEPParty-IDBidenTrumpOtherMargin
Dem37%94%5%1%-89%
Rep36%6%94%0%88%
Ind27%54%41%5%-13%
Share100.0%51.52%46.76%1.72%-4.76%
Recorded100.0%51.31%46.86%1.82%-4.45%
Votes (mil)158.3881.2774.222.89-7.05
REGIONPctBidenTrumpOtherMargin
Urban29%60%38%2%-22%
Suburbs51%50%48%2%-2%
Rural19%42%57%1%15%
Share99%50.88%46.33%1.79%-4.55%
Votes158.480.673.42.8-7.2
Recorded100%51.31%46.86%1.82%-4.5%
Votes158.481.374.22.9-7.0
ModelParty-IDBidenTrumpOtherMargin
Dem37%87%12%1%-75%
Rep37%4%96%0%92%
Ind26%43%52%5%9%
Share100%44.85%53.48%1.67%8.63%
Votes158.471.084.72.613.7

Sensitivity Analysis

Trump%RepTotal votes
96%158.36Trump
% Dem
Trump3%5%7%9%12%
% IndTrump
52%50.2%50.9%51.6%52.4%53.5%
50%49.6%50.4%51.1%51.9%53.0%
48%49.1%49.9%50.6%51.3%52.4%
46%48.6%49.3%50.1%50.8%51.9%
41%47.3%48.0%48.8%49.5%50.6%
Votes
52%79.480.681.882.984.7
50%78.679.880.982.183.9
48%77.878.980.181.383.0
46%76.978.179.380.582.2
41%74.976.177.278.480.2
Biden
52%76.375.174.072.871.0
50%77.175.974.873.671.8
48%77.976.875.674.472.7
46%78.877.676.475.373.5
41%80.879.778.577.375.6
Margin
52%3.15.57.810.213.7
50%1.53.86.28.512.0
48%-0.22.24.56.910.4
46%-1.80.52.95.28.7
41%-5.9-3.6-1.31.14.6

 
Leave a comment

Posted by on October 3, 2021 in Uncategorized


A Logical Analysis proof that Trump won AZ

Richard Charnin Sept. 29, 2021

LINKS TO  BLOG POSTS

Regarding AZ, this is a logical true vote analysis you won’t get from the media (or anywhere else).Consider the 2020 National Exit Poll (which is always forced to match the recorded vote). Note the 37% tie in Party-ID for Dem and Rep voters. Also note that Biden had 94% of Dems and Trump 94% of Repubs.

2020 NEPParty-IDBidenTrumpOther
Dem37%94%5%1%
Rep37%6%94%0%
Ind26%54%41%5%
100.0%51.04%47.29%1.67%

Now check the AZ exit poll. Bidens’ share of Dems was 96%, a 2% increase over his national share. Trump had 90% of Repubs, a 4% decline from his national share. The result is a near tie, with Trump winning by 20,000 (the Official Margin had Biden winning by 10,500 votes).

2020 AZParty-IDBidenTrumpOther
Dem26%96%3%1%
Rep35%9%90%1%
Ind39%53%44%3%
Share100%48.78%49.44%1.78%
Votes3,1441,5341,55456

Is it plausible that Biden would have a 2% higher share in AZ (a red state) over his national share and Trump a 4% lower share of Repubs? Or that Biden would win Independents by 53-44%?

Let’s assume that the AZ vote shares match the national shares and Trump and Biden each have 47% of the Independent vote. Trump wins by 241,000 votes. This is PLAUSIBLE. In fact it is very CONSERVATIVE. We can assume that Trump did better with Repubs than Biden did among Dems. And it’s implausible that Biden won Independents by 9%.

ModelPctBidenTrumpOther
Dem26%94%5%1%
Rep35%6%94%0%
Ind39%47%47%6%
True Share100%44.87%52.53%2.60%
True Votes3,1441,4111,65282
Recorded3,3871,6721,66154

https://docs.google.com/spreadsheets/d/1yh0YkXBVctdJwt0_XHrpCC6f7K30oEz0Vr13MiU5qT4/edit?fbclid=IwAR1MuuGm2Jg6tL4wYSg1bpukg5-GqBp9jlRnVafi9hXasRITXn_UqFa20ws#gid=1570881996

Edison Research
MethodPctBidenTrumpOther
Mail (Telephone)4365341
Early In-Person2450500
Election Day3339592
NEP Total10052.8246.091.09
Recorded10051.3146.861.83

Sensitivity Analysis

Assume the AZ exit poll as the base case scenario

Best Case: Trump wins by 261,000 votes with 53.4%

Base Case: Trump wins by 130,000 votes with 51.4%

Worst Case: Exact tie with 49.3%

2020 AZParty-IDBidenTrumpOther
Dem26%94%5%1%
Rep35%6%94%0%
Ind39%53%44%3%
Share100%47.21%51.36%1.43%
Votes (000)3,1441,4841,61545

Trump % Rep: 94%% Dem
Trump3.0%4.0%5.0% base6.0%7.0%
% IndTrump share
48%52.4%52.7%52.9%53.2%53.4%
46%51.6%51.9%52.1%52.4%52.7%
44% base50.8%51.1%51.36%51.6%51.9%
42%50.1%50.3%50.6%50.8%51.1%
40%49.3%49.5%49.8%50.1%50.3%
Trump Votes
48%1,6471,6561,6641,6721,680
46%1,6231,6311,6391,6471,656
44%1,5981,6071,6151,6231,631
42%1,5741,5821,5901,5981,607
40%1,5491,5581,5661,5741,582
Biden Votes
48%1,4971,4881,4801,4721,464
46%1,5211,5131,5051,4971,488
44%1,5461,5371,529 1,5211,513
42%1,5701,5621,5541,5461,537
40%1,5951,5861,5781,5701,562
Trump Margin
48%196212229245261
46%147163180196212
44%98114130 147163
42%49658198114
40%016324965
 
Leave a comment

Posted by on September 29, 2021 in Uncategorized


Anomalies in the Party-ID and Race demographic changes from the 2016 to 2020 election

Richard Charnin Sept. 26, 2021

LINKS TO  BLOG POSTS

According to the 2016 and 2020 National Exit polls, the net Republican Party-ID percentage increased in ALL but one (MN) of the following swing states. And still the corrupt MSM claims rump lost and there was no fraud. In addition, consider this anomaly: Trump’s vote shares increased in all racial groups except for white voters – his strongest group.

Rep Party-ID20162020Gain
National33%36%3%
AZ32%35%3%
CO24%25%1%
FL33%38%5%
GA36%39%3%
ME30%31%1%
MI31%38%7%
MN35%34%-1%
NC31%37%6%
NH28%31%3%
NV28%35%7%
OH37%39%2%
PA39%41%2%
VA33%34%1%
WI34%37%3%
Average32.2%35.3%3.1%
National 2016RaceClintonTrumpOther
white71%37%57%6%
black12%89%8%3%
latino11%66%28%6%
asian4%65%27%8%
other2%56%36%8%
All100%47.93%46.31%5.76%
Race chgNational 2020RaceBidenTrumpOther
-4%white67%41%58%1%
1%black13%87%12%1%
2%latino13%65%32%3%
0%asian4%61%34%5%
2%other3%55%41%4%
0.0%All100%51.32%47.17%1.51%
National 2016Party-IDClintonTrumpOther
democrats36%89%8%3%
republicans33%8%88%4%
independents31%42%46%12%
All100%47.70%46.18%6.12%
Party-ID chgNationalParty-IDBidenTrumpOther
1%Dem37%94%5%1%
3%Rep36%6%94%0%
-5%Ind27%54%41%5%
0%All100%51.52%46.76%1.72%

https://docs.google.com/spreadsheets/d/1yh0YkXBVctdJwt0_XHrpCC6f7K30oEz0Vr13MiU5qT4/edit?fbclid=IwAR14PM72yB2iOpMns19z9BrNX0E9amYcbi68Dq_Y-EFoFAMN8xJ9DT-CyKI#gid=1445991396

 
Leave a comment

Posted by on September 26, 2021 in Uncategorized


Arizona Audit finds 318,000 illegal ballots

Richard Charnin Sept. 25, 2021

LINKS TO  BLOG POSTS

AZ Maricopa Audit Finds 318,000 illegal ballots. We still need the servers to see how many votes were flipped from Trump to Biden. Supposedly the county vote flips are in the PCAPS. Mike Lindell, what are you waiting for?

The audit results are close to the 339,000 illegal ballots (229,000 unknown and 110,000 undeliverable) from https://publicinterestlegal.org/wp-content/uploads/2021/05/Mail-Voting-2012_2020-1P-1.pdf

Audit Findings

1 Canvass showed over 3,400 more ballots were cast than recorded

2 Over 9,000 more mail-in ballots were received and recorded than the official number of mail-in ballots sent out by the county

3 Precincts show 1551 more ballots cast on election day than people who showed up to vote.

4 Approximately 2,500 ballots were shown in the early vote returns that do not have a voter listed as casting them.

5 Over 255,000 early votes shown in the county final vote file do not have a corresponding entry in the early voting returns file

6 Over 23,000 voted by mail after moving after the October 5th cutoff

7 2,382 voters cast votes in Maricopa county, in person, after moving out of the county

8 Over 2,000 voters who moved out of Arizona during the 29 days before the election were given a full ballot instead of a presidential-only ballot.

9 Close to 300 deceased voters potentially voted.

10. 17,000 ballots had illegal or missing signatures (Dr. Shiva M.I.T. PhD) https://vashiva.com/

 
Leave a comment

Posted by on September 25, 2021 in Uncategorized


Edison Research Exit Polls always match the recorded vote count

Richard Charnin Sept. 24, 2021

LINKS TO  BLOG POSTS

How long will Edison Research mislead the public by adjusting exit polls to match the recorded vote and assume zero election fraud? ER has been getting away with this since I began analyzing polls in 2000.

2020 National Exit PollParty IDBidenTrumpOther
Dem37%94%5%1%
Rep36%6%94%0%
Ind27%54%41%5%
NEP total100%51.52%46.76%1.72%
Recorded100%51.31%46.86%1.83%
Votes (mm)158.3881.2774.222.90
2020 Election ModelParty-IDBidenTrumpOther
Dem37%87%12%1%
Rep37%4%96%0%
Ind26%43%52%5%
Model total100.0%44.85%53.48%1.67%
Votes147.0065.9378.622.45
National (in pct)
How votedPctBidenTrumpOther
Mail (Telephone)4365341
Early In-Person2450500
Election Day3339592
NEP Total 10052.8246.091.09
Recorded51.3146.861.83
GA (in pct)
How votedPctBidenTrumpOther
Mail (Telephone)2664.534.31.2
Early In-Person5446.452.70.9
Election Day2037.9602.1
NEP Total10049.4149.381.22
Recorded49.4749.241.29
NC (in pct)
How votedPctBidenTrumpOther
Mail (Telephone)1870.327.91.8
Early In Person6546.652.70.7
Election Day1732.864.72.5
NEP Total10048.5250.281.20
Recorded48.5949.931.48
GA Runoff 1 (pct)
How votedPctOssoffPerdue
Mail (Telephone)2467.732.3
Early In Person4650.649.4
Election Day3036.663.4
NEP Total10050.50449.496
Recorded50.649.4
GA Runoff 2 (pct)
How votedPctWarnockLoeffler
Mail (Telephone)2468.231.8
Early In Person465149
Election Day3037.162.9
NEP Total10050.9649.04
Recorded51.049.0

https://www.edisonresearch.com/wp-content/uploads/2021/01/Edison-Research-2020-Election-Recap.pdf
 
Leave a comment

Posted by on September 24, 2021 in Uncategorized


CNN AZ exit poll vs. 2020 Election Model

Richard Charnin Sept. 23, 2021

LINKS TO  BLOG POSTS

The CNN AZ County Exit Poll indicates a tie with Maricopa going to Biden by 2% (RIDICULOUS) ! WAIT UNTIL YOU SEE THE MARICOPA AUDIT RESULTS ON SEPT.24…

The BOGUS AZ exit poll indicates that Trump won the Party-ID demographic by just 0.66%. The 2020 Election Model indicates Trump won AZ by 12.2%.

AZPctBidenTrumpOther
Dem26.0%96.0%3.0%1.0%
Rep35.0%9.0%90.0%1.0%
Ind39.0%53.0%44.0%3.0%
Share100.0%48.78%49.44%1.78%
AZ CountyPctBidenTrumpOther
Maricopa61%50%48%2%
Pima15%59%41%0%
Other24%41%57%2%
Share100%49.19%49.11%1.70%
AZ ModelBidenTrumpOtherMargin
Party ID39.4%43.7%16.9%4.3%
Share43.3%55.5%1.2%12.2%
Recorded49.4%49.1%1.6%-0.3%
Votes1,3611,74439383

https://www.cnn.com/election/2020/exit-polls/president/arizona

Biden “margin”
Arizona10,457
Nevada33,596
UnknownUndeliverable
Clark county724,70893,279
Maricopa Cty229,123110,092
 
Leave a comment

Posted by on September 23, 2021 in Uncategorized


David Ray Griffin: The most prolific 9/11 truth teller

David Ray Griffin: The most prolific 9/11 truth teller has written at least 10 books on 9/11..https://www.thriftbooks.com/a/david-ray-griffin/204510/

 
Leave a comment

Posted by on September 11, 2021 in Uncategorized


LATEST VAERS (US) COVID VACCINE ADVERSE EVENT DATA

Richard Charnin Sept. 4, 2021

LINKS TO  BLOG POSTS

LATEST VAERS (US) COVID VACCINE ADVERSE EVENT DATA THROUGH AUG 8, 2021.

VAERS is a database maintained by the CDC.

THERE WERE AN ESTIMATED 250,000 DEATHS FROM VACCINES IN 7 MONTHS COMPARED TO 30,000 PURE COVID DEATHS (ZERO COMORBIDITIES} IN 20 MONTHS!

In 2021, there were 571,830 reports of adverse effects in 7 months (12,791 deaths). Only an estimated 1% of adverse events are reported in VAERS. There would be an estimated 250,000 deaths if 20% were reported and 1.25 million if 100% were reported.

Compare VAERS to the 665,000 total COVID deaths reported in 20 months. Only an estimated 5% (30,000) were pure COVID (ZERO COMORBIDITIES).

TOTAL ADVERSE EVENTS: DEATHS: 12,791, LIFE THREATENING: 13,140, PERMANENTLY DISABLED: 16,044, HOSPITALIZATIONS: 51,242, ANAPHYLAXIS: 5,282, BELL’S PALSY: 4,461, MISCARRIAGES: 1,505, HEART ATTACKS: 5,590, SEVERE ALLERGY: 24,305, SHINGLES: 6,784

“Adverse Events Reported Following COVID-19 Vaccinations” Updated Aug. 28, 2021. Prepared by Josh Guetzkow, PhD http://www.skirsch.com/covid/VAERS_reporting.pdf 

There has been a dramatic increase in the number of reports submitted to the US Vaccine Adverse Events Reporting System (VAERS) following the rollout of COVID-19 vaccines. For example, as of Aug. 6, 2021, reports of serious events and deaths following COVID-19 vaccines represented 39% of serious events and 51% of deaths ever reported to VAERS since 1990. In this report, I present data and analysis to respond to two questions about this increase:

1. Is the increase in reports due to the increase in the number of vaccinations?

2. Is the increase in reports due to what public health officials refer to as “stimulated reporting,” meaning that people are reporting more due to increased awareness of the existence of VAERS and/or increased fear surrounding the COVID-19 vaccines due to media exposure of adverse events, awareness of the reporting system, mobilization by vaccine critics, etc.

  • Like
 
Leave a comment

Posted by on September 4, 2021 in Uncategorized


Cyber Symposium: Votes Flipped in all 50 states

Richard Charnin Aug. 12, 2021

LINKS TO  BLOG POSTS

Interesting data results from the Cyber Symposium

1-Recorded and PCAP total votes EXACTLY match proving machine vote flips

2-Recorded (155.485 million) ; PCAP (155.484m)

3- 8.1% (6.5m) Trump PCAP cyber votes were FLIPPED to Biden: 80.7m to 74.2m

4-PCAP totals DO NOT include an estimated 8m EXCESS (illegal) ballots for Biden

5-Machine votes were flipped to Biden in each of the 50 states

Votes (millions) TRUMP BIDEN

Recorded (rigged): 74.2-81.3 ; 46.9-51.3% ; 232EV

PCAP(includes illegal Biden ballots}: 80.7-74.7 ; 51.9-48.1% (2-pty) ; 325EV

PCAP (deduct estimated 8m illegal Biden ballots): 80.7-67.3 ; 54.6-45.4% (2-pty) ; 347EV

Model1 (Party-ID): 79.1-66.1 ; 53.8-45.0% ; 389EV

View the results: https://docs.google.com/spreadsheets/d/1yh0YkXBVctdJwt0_XHrpCC6f7K30oEz0Vr13MiU5qT4/edit#gid=639160994

Where did the data come from? https://rumble.com/vl4me5-the-pcaps-august-13th-2021.html

 
Leave a comment

Posted by on August 12, 2021 in Uncategorized


My 2020 Election Model matches expert Seth Keshel’s analysis

Richard Charnin Aug. 3, 2021

LINKS TO  BLOG POSTS

Elections Expert Seth Keshel Releases National Fraud Numbers: Finds 8.1 Million Excess Votes in US Election, Affirms Trump Won PA, MI, WI, NV, AZ, GA and MN

Adjusting Keshel’s 2020 analysis to include vote flipping and comparing to my 2020 Election Model, Keshel determined that 8.1 million of Biden’s 81.2 million (10%) votes were excess (i.e. illegal). If the 10% adjustment is applied to each state, Trump is a winner by 74.2-73.3m with 311 Electoral Votes.

But what about votes flipped from Trump to Biden? Assume 10% of votes were flipped. Applying the 10% to each state, Trump wins by 81.6-65.7m and has 356 Electoral Votes. This is virtually the same result as the 2020 Election Model which is based on party-id voter turnout and estimated party-id vote shares.

Adjusted Keshel analysis. Go row 53: https://docs.google.com/spreadsheets/d/1yh0YkXBVctdJwt0_XHrpCC6f7K30oEz0Vr13MiU5qT4/edit#gid=12205940

2020 Election Model: https://docs.google.com/spreadsheets/d/1yh0YkXBVctdJwt0_XHrpCC6f7K30oEz0Vr13MiU5qT4/edit#gid=297739797

 
Leave a comment

Posted by on August 3, 2021 in Uncategorized


Covid-19 Quiz

Richard Charnin – July27, 2021

LINKS TO  BLOG POSTS

1How many PCR cycles required for Covid case confirmation?
a) 20, b) 30, c) 40
2How may seniors died after transfer to NYC Nursing homes?
a) 5,000, b)10,000, c)15,000
3What is the approximate comorbidity rate according to the CDC?
a) 88%, b) 93%, c) 95%
4What is the minimum percent of reported vaccine deaths according to VAERS database?
a) 1%, b) 3%, c) 5%
5Covid Vaccine deaths exceed the total number of deaths from all vaccines in the past
a) year, b)10 years, c) 20 years
6Current reported VAERS deaths?
a) 5,000, b)12,000, c)15,000
7Current estimated VAERS deaths?
a) 30,000, b) 45,000, c) 55,000
8How many times did Fauci flip on masks?
a) 2, b) 3, c) 4
9What is the estimated Covid mortality rate?
a) 1.0%, b) 0.5%, c) 0.3%
10What is the estimated Covid mortality rate for <18 year old?
a) 0.3%, b) 0.1%, c) 0.001%
11Sweden Covid death rate?
a) .001%, b) 0.0001%, c) zero
12How many flu deaths reported in 2020-21?
a) 50,000, b) 25,000, c) virtually ZERO
13Why has HCQ not been promoted by the FDA/MSM?
a) dangerous drug, b) no historical track record, c) no income for Big Pharma
 
1 Comment

Posted by on July 27, 2021 in Uncategorized


VAERS VACCINE DATA ADVERSE EVENTS AS OF JULY 2, 2021

LINKS TO  BLOG POSTS

From:OpenVAERSAlert.com

“The Vaccine Adverse Events Reporting System (VAERS) was established in 1990 as an early warning system to detect possible safety problems in U.S.-licensed vaccines. Reporting is voluntary and this leads to significant undercounting of harms. Harvard Pilgrim Health Care conducted a study for U.S. Department of Health and Human Services that concluded that “fewer than 1% of vaccine adverse events are reported.

”1 This week’s new numbers are horrifying. 2,063 new deaths were added making it the deadliest week ever recorded by VAERS. There are now 9,048 reports of fatalities following these shots in the last 7 months and we know that this is just a fraction of the real total. This is the most catastrophic vaccine campaign in U.S. history. The coronavirus vaccine campaign has killed more Americans than all other vaccines combined over the last 30 years. The data show that these products must be pulled from the market immediately. To put this in perspective, the 1976 swine flu vaccine campaign was halted after 25 deaths and 500 cases of Guillain-Barre Syndrome out of 40 million doses administered.

2 Why are public health officials today so callous about levels of death and injury that are hundreds of times worse than the 1976 vaccine campaign? How many coronavirus vaccine deaths is too many for you? What will it take for you to say “Enough!” We are asking you to use your voice to stop this disastrous medical experiment”.

 
Leave a comment

Posted by on July 15, 2021 in Uncategorized


Democrat Operatives in Michigan and Georgia Tampered with Military Ballots — Filled Out New Ones 100% MARKED FOR JOE BIDEN

Richard Charnin May 25, 2021

LINKS TO  BLOG POSTS

“The Michigan Senate Oversight Committee on Tuesday held a hearing in Lansing on election fraud and irregularities.

President Trump was ahead of Joe Biden in Michigan on election night when all of a sudden they stopped counting votes.

At around 4:30 AM AFTER Election Day, a massive ballot dump of more than 130,000 votes appeared for Joe Biden in Michigan.

One GOP elections observer on Tuesday said all of the military ballots she saw looked like “Xerox copies” of each other – none were registered Michigan voters and 100% went for Joe Biden”.

—–


https://www.thegatewaypundit.com/2020/12/pure-evil-democrat-operatives-michigan-georgia-tampered-military-ballots-filled-new-ones-100-marked-joe-biden/

 
Leave a comment

Posted by on May 25, 2021 in Uncategorized


The Democrats and the Media does not want to allow the 2020 Election Audit in Maricopa County, AZ.

 
Leave a comment

Posted by on April 23, 2021 in Uncategorized


CDC: Side-effects of Wearing a Mask

Richard Charnin

4/21/21

LINKS TO  BLOG POSTS

An article published by the CDC in June 2020 states side-effects of wearing a mask, specifically trapping carbon dioxide or CO2. The article states that the masks cause breathing resistance which could result in a reduction in the frequency and depth of breathing, known as hypoventilation, in as little as an hour of wearing a mask.

The article further went onto elaborate of the side-effects of increased CO2 concentrations in the mask wearer that include:

1 Headache

2 Increased pressure inside the skull

3 Nervous system changes

4 increased pain threshold

5 reduction in cognition

6 altered judgement

7 decreased situational awareness

8 difficulty coordinating sensory or cognitive abilities and motor activity

9 decreased visual acuity

10 widespread activation of the sympathetic nervous system that can oppose the direct effects of CO2 on the heart and blood vessels

11 Increased breathing frequency

12 Increased “work of breathing”, which is a result of breathing through a filter medium

13 Cardiovascular effects (e.g., diminished cardiac contractility, vasodilation of peripheral blood vessels)

14 Reduced tolerance to lighter workloads.

Rand Paul Criticizes Dr. Fauci Over Mask Mandate; Newly Uncovered CDC Document Shows Adverse Effects

 
Leave a comment

Posted by on April 21, 2021 in Uncategorized


NY Times: PA and GA vote timelines show Trump losing votes. How do votes disappear?

Richard Charnin Feb.5, 2021

LINKS TO  BLOG POSTS

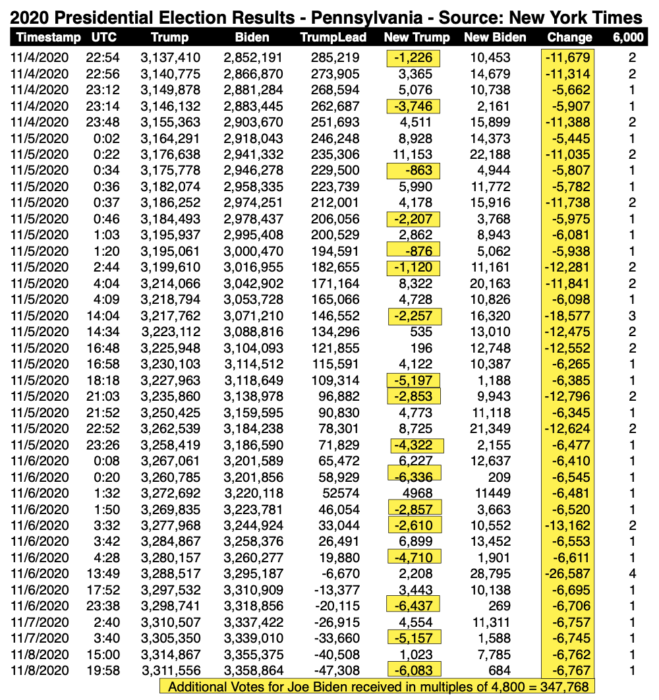
How do votes disappear? The NY Times PA data timeline shows Trump losing votes. But the Times says do not believe your lying eyes; there was no election fraud. A statistical analysis of New York Times data in Philadelphia claims a suspicious string of voting “ratios” benefiting Biden, as also happened in Georgia.

By 11pm Election Day, Trump was leading Biden by about 285,000 votes. Then, 347,768 votes from somewhere dumped into the system in 44 batches in increments of approximately 6,000, 12,000, or 18,000 additional net votes for Biden. As a result, Biden came back from an election night deficit of 285,000 to a 46,000 vote win four days later. https://centralcitynews.us/wp-content/uploads/2020/11/Central-City-News-11-19-20-Small.pdf

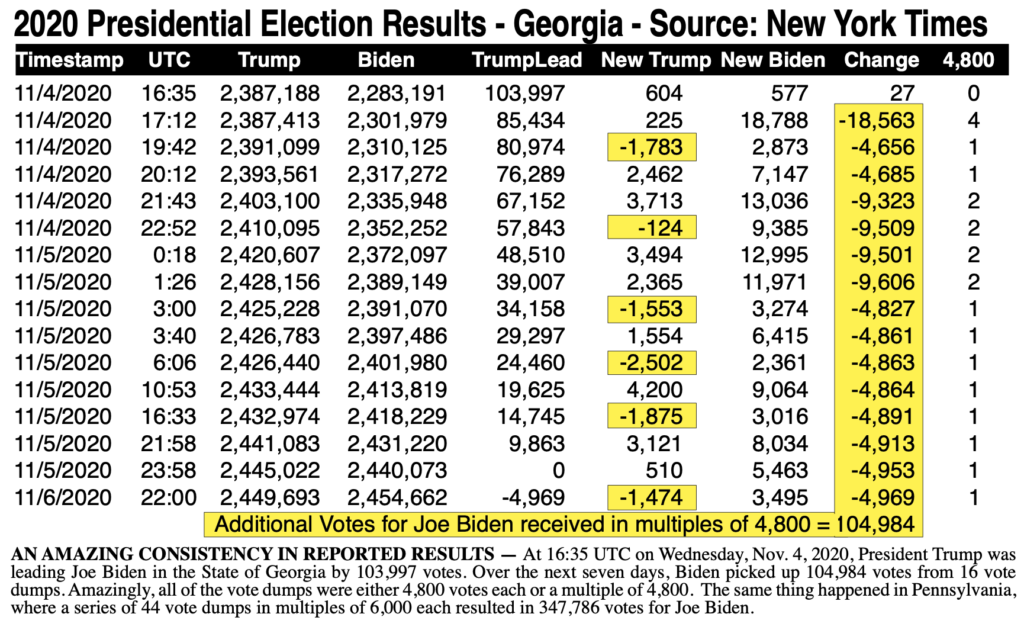
The NY Times GA data timeline also shows Trump losing votes. But the Times says do not believe your lying eyes; there was no election fraud. Statistical analysis shows Biden pulling from behind in improbably consistent increments in Georgia and other states.

“On Wednesday, Nov. 4, the New York Times reported President Trump was leading in Georgia by 103,997 votes. Then the Times’ continuous voting updates showed ballots arriving for Biden in multiples of 4,800 votes over and over again. In some vote dumps, the President actually lost votes.” This continued until Biden pulled ahead by almost exactly 1,000 votes, gaining 104,984 votes in multiples of 4,800.

https://sharylattkisson.com/2020/12/what-youve-been-asking-for-a-fairly-complete-list-of-some-of-the-most-significant-claims-of-2020-election-miscounts-errors-or-fraud/

 
4 Comments

Posted by on February 5, 2021 in Uncategorized


Trump 2020: 25 scenarios

Richard Charnin – Jan. 27, 2021

LINKS TO  BLOG POSTS

(based on estimated turnout and vote shares)

Trump range: Share 52.6% to 56.8%; Votes: 83.3m to 90.0m; margin: 11.7m to 25.1m

https://docs.google.com/spreadsheets/d/1yh0YkXBVctdJwt0_XHrpCC6f7K30oEz0Vr13MiU5qT4/edit#gid=297739797

DemRepInd
Gallup ID31.0%31.0%38.0%
Trump %12.0%96.0%57.0%
Turnout94%98%96%
Base caseBidenTrump
Vote share41.6%56.2%
Votes65.989.0
% Dem
10.0%11.0%12.0%13.0%14.0%
% IndTrump
57%55.6%55.9%56.2%56.5%56.8%
55%54.9%55.2%55.5%55.8%56.1%
53%54.1%54.4%54.7%55.0%55.3%
51%53.4%53.6%53.9%54.2%54.5%
49%52.6%52.9%53.2%53.5%53.8%
Votes
57%88.188.689.089.590.0
55%86.987.487.888.388.8
53%85.786.286.687.187.6
51%84.585.085.485.986.4
49%83.383.884.284.785.2
Margin
57%21.322.323.224.125.1
55%18.919.820.821.722.7
53%16.517.418.419.320.3
51%14.115.016.016.917.9
49%11.712.613.614.515.5
 
17 Comments

Posted by on January 27, 2021 in Uncategorized


Navarro Report Volume 3: Yes, President Trump WON – The Case, Evidence, & Statistical Receipts

Richard Charnin Jan. 15, 2020

LINKS TO  BLOG POSTS

This third installment of Navarro’s report provides investigators with up-to-date statistical “receipts” and a well-documented tally of potentially illegal votes on a state-by-state and category-by-category basis. Source: NavarroReport.com:

Volume 3 provides a scholarly rendering of the potential number of illegal votes in the 2020 election. Peter Navarro welcomes anyone who wishes to dispute its findings “because that is the nature of scholarly discourse.”

Note: The above table does not include 1) estimated 2.5% machine vote flipping from Trump to Biden, 2) Dr. Epstein’s estimate that 6-10% of Trump voters flipped to Biden from the propaganda effect of Google algorithms which favored Biden, and 3) a survey which found that 7% of Biden voters would have voted for Trump if they knew about the Biden scandals.

Model 1: cell A95 https://docs.google.com/spreadsheets/d/1yh0YkXBVctdJwt0_XHrpCC6f7K30oEz0Vr13MiU5qT4/edit#gid=297739797

Model 2: cell M8 https://docs.google.com/spreadsheets/d/1yh0YkXBVctdJwt0_XHrpCC6f7K30oEz0Vr13MiU5qT4/edit#gid=376710386

Illegal voters, Biden margin, Trump margin – Election models 1&2

AZGAMINVPAWI
Illegal votes255601447220992554
Biden margin1012155348221
Trump Model 1490751563217812405
Trump Model 25928798552201,164566
 
14 Comments

Posted by on January 15, 2021 in Uncategorized


Senate runoff: What is the probability of a 150,000 vote spike for the Dems 10 minutes after stopping the count?

Richard Charnin Jan.6, 2021

LINKS TO  BLOG POSTS

The corrupt MSM, Dems and Repubs will say they don’t see anything suspicious in the graph and that we should not believe our lying eyes. What is the probability of a 150,000 vote spike for the Dems 10 minutes after stopping the count? Looks like the PA election late night vote dump, but on a smaller scale.

 
4 Comments

Posted by on January 6, 2021 in Uncategorized


A closer look at U.S. deaths due to COVID- 19

Richard Charnin – Jan. 3, 2021

LINKS TO  BLOG POSTS

Deaths from other causes are included in the COVID-19 total…

“When Briand looked at the 2020 data during that seasonal period, COVID-19-related deaths exceeded deaths from heart diseases. This was highly unusual since heart disease has always prevailed as the leading cause of deaths. However, when taking a closer look at the death numbers, she noted something strange.

As Briand compared the number of deaths per cause during that period in 2020 to 2018, she noticed that instead of the expected drastic increase across all causes, there was a significant decrease in deaths due to heart disease. Even more surprising, as seen in the graph below, this sudden decline in deaths is observed for all other causes.

This trend is completely contrary to the pattern observed in all previous years. Interestingly, as depicted in the table below, the total decrease in deaths by other causes almost exactly equals the increase in deaths by COVID-19. This suggests, according to Briand, that the COVID-19 death toll is misleading. Briand believes that deaths due to heart diseases, respiratory diseases, influenza and pneumonia may instead be recategorized as being due to COVID-19″ . https://archive.is/DJdin

 
Leave a comment

Posted by on January 3, 2021 in Uncategorized


The Electoral vs. Popular vote Myth

Richard Charnin – Jan.3, 2021

LINKS TO  BLOG POSTS

The conventional wisdom is that a presidential candidate could win the popular vote and lose the electoral vote – or vice versa. This is extremely unlikely in a fair election; there is virtually a 100% probability that the winner of the popular vote would win the electoral vote. But all elections are fraudulent to some extent.

The Democrats want to get rid of the electoral college and replace it with the winner of the popular vote, thinking this would help them win elections in the future. But this is based on the  premise that they can more easily win or steal the popular vote, like they  have done in the last two elections. Consider the 2000, 2004, 2016 and 2020 elections, all of which were fraudulent.

Bush stole the 2000 election. He won the Electoral vote by 271-267.  Gore won the recorded popular vote by 540,000 and the true vote by at least 5 million. He led the unadjusted exit polls in 11 states but lost them all in the vote. If he had won just one, he would have won the election.

Bush stole the 2004 election. He won the bogus recorded popular vote by 3 million and the electoral vote by 286-252.. But Kerry won the true popular vote and the unadjusted exit polls by at least 7 million. He  had approximately 349 electoral votes.

Clinton tried to steal the 2016 election. She won the bogus recorded vote by 3 million. But Trump won the electoral vote by 306-232 as well as the true popular vote.

Biden stole the 2020 election, the most fraudulent in history. He won the bogus recorded vote by 7 million and the electoral vote 306-232. But Trump won the true popular vote by 15-18 million with 356-393 electoral votes.

2020 Recorded Vote: Biden 51.3-46.9%, 306-232 EV; True Vote Model: Trump 55.1-42.7%, 393 EV https://docs.google.com/spreadsheets/d/1yh0YkXBVctdJwt0_XHrpCC6f7K30oEz0Vr13MiU5qT4/edit#gid=297739797

2016 Recorded Vote: Clinton 48.3-46.2%, Trump 306-232 EV; True Vote Model: Trump 47.5-46.1%, 354-184 EV https://richardcharnin.wordpress.com/2016/11/07/2016-election-model-forecast/ https://docs.google.com/spreadsheets/d/1sGxtIofohrj3POpwq-85Id2_fYKgvgoWbPZacZw0XlY/edit#gid=1739803045

2004 Recorded Vote: Bush 50.7- 48.3%, Bush 286-252 EV; True Vote Model: Kerry 53.6-45.1%, 364 EV; Unadjusted National Exit Poll: Kerry 51.7-47.0%; Unadjusted State Exit Polls: Kerry 51.1-47.6%, 349 EV https://richardcharnin.wordpress.com/2012/02/21/the-final-2004-national-exit-poll-switched-7-2-of-kerry-responders-to-bush/ https://docs.google.com/spreadsheet/ccc?key=0AjAk1JUWDMyRdGN3WEZNTUFaR0tfOHVXTzA1VGRsdHc#gid=0

2000 Recorded Vote: Gore 48.4-Bush 47.9%, Bush 271- 267 EV; True Vote Model: Gore 51.5-44.7%, 404 EV; Unadjusted National Exit Poll: Gore 48.5-46.3%; Unadjusted State Exit Polls aggregate: Gore 50.8-44.4% https://richardcharnin.wordpress.com/2011/11/21/unadjusted-state-exit-polls-indicate-that-al-gore-won-a-mini-landslide-in-2000/ https://docs.google.com/spreadsheet/ccc?key=0AjAk1JUWDMyRdFIzSTJtMTJZekNBWUdtbWp3bHlpWGc#gid=4

 
11 Comments

Posted by on January 3, 2021 in Uncategorized


2020 National Exit Poll: How did you vote in 2016, Party-ID, Sensitivity analysis of alternate vote share assumptions

Richard Charnin – Dec. 5, 2020

LINKS TO  BLOG POSTS

We are constantly fed propaganda by the media and politicians that Clinton won the popular vote by 2.8 million. But the NEP How Voted 2016 demographic indicates that 43% voted for Trump and 40% for Clinton. Trump had a much bigger margin in 2020 than he did in 2016. Election fraud in 2020 is massive. Biden won the bogus reported vote by 80.7-74.6 million (51.0-47.1%). But Trump won the election in a landslide. This should be obvious to anyone who looks at the overwhelming evidence of fraud. The 2020 National Exit Poll (NEP) forced a match to the fraudulent reported vote. The focus is on two demographics: returning 2016 voters and party affiliation.

In the 2016-1 analysis, the 2016 reported vote (Clinton by 48.2-46.1%) is assumed as the basis for voter turnout in 2020. Trump wins by 6.1 million votes (50.6-48.4%). In 2016-2, returning voters are based on the 2020 NEP (Trump by 43-40%). Trump wins by 12.0 million votes (53.2-44.8%). In both cases, equal turnout rates of Trump and Clinton voters is assumed. This is conservative. Historically, Republicans turn out at higher rates than Democrats.

2020 NEP MixBidenTrumpOther
Clinton40%95%4%1%
Trump43%7%92%1%
Other5%60%25%15%
DNV (new)12%58%39%3%
Calculated100.0%51.0%47.1%1.9%
Vote (mil)158.3882.0875.131.17
Margin6.95
Recorded100.0%51.3%46.9%1.8%
Vote 158.3881.2774.222.90
2016-1 MixBidenTrumpOther
Clinton44.4%90%7%3%
Trump42.5%2%96%2%
Other5.2%37%55%8%
DNV (new)7.9%48%52%0%
Calculated100.0%46.5%50.9%2.6%
Vote (mil)142.066.172.23.7
Margin6.1
2016-2MixBidenTrumpOther
Clinton38.8%90%8%2%
Trump41.4%2%96%2%
Other4.2%37%55%8%
DNV (new)15.6%48%52%0%
Calculated100.0%44.8%53.2%1.9%
Vote (mil)142.063.675.62.8
Margin12.0

2020 NEP
Voted 2016ClintonTrumpOtherDNV
National40%43%5%12%
FL38%44%5%13%
PA41%44%4%11%
OH36%46%5%13%
GA38%40%5%17%
MN39%41%8%12%
WI39%42%7%12%
MI40%42%4%14%
AVG38.7%42.7%5.4%13.1%

In the Sensitivity analysis of 25 scenarios: Trump has 92-96% share of returning Trump voters and 6-10% of Clinton voters. His vote margins range from 5.1 (worst case) to 14.2 million (best case).

Trump %
Other 55%
DNV 52%%Clinton
6%7%8%9%10%
% TrumpTrump
96%52.5%52.9%53.2%53.6%54.0%
95%52.1%52.4%52.8%53.2%53.6%
94%51.6%52.0%52.4%52.8%53.2%
93%51.2%51.6%52.0%52.4%52.8%
92%50.8%51.2%51.6%52.0%52.4%
Biden
96%45.6%45.2%44.8%44.4%44.0%
95%46.0%45.6%45.2%44.8%44.5%
94%46.4%46.0%45.6%45.3%44.9%
93%46.8%46.4%46.1%45.7%45.3%
92%47.2%46.9%46.5%46.1%45.7%
Margin
96%6.9%7.6%8.4%9.2%10.0%
95%6.0%6.8%7.6%8.4%9.1%
94%5.2%6.0%6.8%7.5%8.3%
93%4.4%5.2%5.9%6.7%7.5%
92%3.6%4.3%5.1%5.9%6.7%
Margin
96%9.810.912.013.114.2
95%8.69.710.811.913.0
94%7.48.59.610.711.8
93%6.27.38.49.510.6
92%5.16.27.38.49.5

In the Party-ID demographic, Democrats comprised 37% and Republicans 36%. Biden won 94% of Democrats and 6% of Republicans, Trump won 94% of Republicans and just 5% of Democrats. But Biden led Independents by 54-41%, giving him a 7.5 million vote margin (51.5-46.8%). In the adjusted calculation, I use the latest Gallup voter affiliation weights (31D-31R-28I) and estimate that Trump had 52% of Independents and won by 6.8 million votes (50.6-47.1%).

View the spreadsheet calculations. https://docs.google.com/spreadsheets/d/1yh0YkXBVctdJwt0_XHrpCC6f7K30oEz0Vr13MiU5qT4/edit#gid=0

The National Exit Poll: https://www.cnn.com/election/2020/exit-polls/president/national-results

This article from Paul Craig Roberts, an eminent historian, spells it all out.

 
Leave a comment

Posted by on December 5, 2020 in Uncategorized


2020 Cyber Symposium (CPACS) vs. Recorded vote

Richard Charnin July 3, 2022

2020 Cyber Symposium (CPACS) vs. Recorded vote

There was a constant 4.1% discrepancy in Trumps symposium vs. reported votes in nearly all states. This indicates that the Cyber electronic vote counts likely used the same algorithm. The Cyber vote does not include stuffed ballots after closing (see “2000 Mules”) and other fraud factors, so that Trump may have won by nearly 14 million votes.

https://civildeadline.com/mike-lindell-reveals-real-election-results-during-cyber-symposium/

“On August 11, 2020 Mike Lindell counted off most every State with their true election results after the electronic fraud has been removed. All 50 States were affected by the hacking of our voting systems. He used the actual packet captures to obtain the results. He also stated, the 74,000,000 votes for Biden may have an additional 16,000,000 removed by forensic audits for what will be determined to be human fraud. All 50 States were affected to some degree. This must be addressed by Americans who seek the truth”.

https://docs.google.com/spreadsheets/d/1yh0YkXBVctdJwt0_XHrpCC6f7K30oEz0Vr13MiU5qT4/edit?fbclid=IwAR0EJG579_bnPFv35sDndHcX2K1ztrNWqulPmVA-NEIU-8yC3Xub6MAy9tQ#gid=584196755

2020 Cyber symposium Recorded

TOTAL TRUMP BIDEN TRUMP BIDEN Diff

Votes 80,746 74,611 74,284 81,253 6,135

Share 51.0% 47.1% 46.9% 51.3% 4.08%

TRUMP BIDEN TRUMP BIDEN Diff

AK 57.0% 38.7% 52.8% 42.8% 4.19%

AL 66.2% 32.4% 62.0% 37.1% 4.13%

AR 66.4% 30.7% 62.4% 35.8% 4.04%

AZ 53.2% 45.2% 49.1% 50.2% 4.11%

CA 38.4% 59.4% 34.3% 64.9% 4.11%

CO 46.0% 51.3% 41.9% 56.9% 4.06%

CT 43.3% 55.1% 39.2% 60.2% 4.09%

DC 9.3% 88.0% 5.4% 94.5% 3.89%

DE 43.8% 54.5% 39.8% 59.6% 4.05%

FL 55.4% 43.7% 51.2% 48.3% 4.16%

GA 53.4% 45.3% 49.2% 50.1% 4.14%

HI 38.3% 59.5% 34 .3% 65.0% 4.03%

IA 57.2% 40.7% 53.1% 45.8% 4.10%

ID 67.9% 28.9% 63.8% 34.1% 4.02%

IL 44.6% 53.5% 40.6% 58.7% 4.07%

IN 61.1% 36.8% 57.0% 41.8% 4.11%

KS 60.3% 37.4% 56.2% 42.5% 4.05%

KY 66.2% 32.0% 62.1% 36.8% 4.08%

LA 62.6% 35.7% 58.5% 40.5% 4.11%

MA 36.2% 61.5% 32.1% 67.1% 4.10%

MD 36.2% 61.2% 32.2% 67.0% 4.07%

ME 48.0% 49.1% 44.0% 54.7% 3.94%

MI 52.0% 46.5% 47.8% 51.4% 4.13%

MN 49.4% 48.3% 45.3% 53.6% 4.09%

MO 61.3% 38.1% 56.8% 42.2% 4.50%

MT 60.6% 36.2% 56.9% 41.6% 3.71%

MS 62.1% 36.8% 57.6% 41.6% 4.51%

NC 54.1% 44.4% 49.9% 49.3% 4.14%

ND 69.1% 27.6% 65.1% 32.8% 3.99%

NE 62.2% 35.0% 58.2% 40.2% 3.99%

NH 49.4% 48.5% 45.4% 53.8% 4.01%

NJ 45.5% 53.2% 41.4% 58.1% 4.14%

NM 47.5% 50.1% 43.5% 55.5% 4.01%

NV 47.6% 45.9% 47.7% 51.2% -0.07%

NY 41.9% 56.7% 37.8% 61.7% 4.16%

OH 57.4% 41.1% 53.3% 45.9% 4.14%

OK 69.5% 28.1% 65.4% 33.1% 4.09%

OR 44.4% 52.4% 40.4% 58.3% 4.06%

PA 53.0% 45.8% 48.8% 50.6% 4.16%

RI 42.7% 55.2% 38.6% 60.6% 4.07%

SC 59.2% 39.3% 55.1% 44.1% 4.13%

SD 65.8% 31.5% 61.8% 36.6% 4.01%

TN 64.8% 31.4% 60.7% 38.2% 4.11%

TX 56.2% 42.3% 52.1% 47.2% 4.14%

UT 70.1% 37.6% 58.1% 39.3% 11.95%

VA 48.1% 50.0% 44.0% 55.2% 4.11%

VT 34.6% 61.8% 30.7% 68.3% 3.89%

WA 42.8% 53.9% 38.8% 59.9% 4.04%

WI 52.9% 45.3% 48.8% 50.3% 4.12%

WV 65.2% 25.5% 68.6% 30.2% -3.44%

WY 73.7% 22.4% 69.9% 27.5% 3.77%

https://rumble.com/vl1o3j-true-2020-election-results-provided-by-cyber-symposium.html

#truethevote #cyber symposium #DonaldTrump #MikeLindell

 
2 Comments

Posted by on July 3, 2022 in Uncategorized


CNN Biden 12/16 approval is 49%, but is 34% when calculated using poll respondents political affiliation and vote shares

Richard Charnin 12/16/21

LINKS TO  BLOG POSTS

CNN misleads on Biden Approval (49%). But it is just 34% based on their own internal polling numbers (calculations below). Of course, do you really expect the truth from the MSM?

“The 12/16 poll finds roughly two-thirds (66%) have doubts and reservations about Biden’s leadership, including 92% of Republicans, 75% of independents and 36% of Democrats. Still, Biden’s overall approval holds about even at 49% approve to 51% disapprove. Those approval ratings are similar to recent polls from AP-NORC and Reuters/Ipsos”.

But the ratings conflict with the actual poll calculation which shows that Biden has 34% approval. And this assumes that Biden’s vote shares are legitimate and were not inflated. If they were, his True approval is even lower than 34%. Biden has 33% approval if the 2020 National Exit poll party-ID weights are used.

View the Reuters poll below: Biden 48% approve; 46% disapprove? Sure, and I have a bridge in Brooklyn for you. But at least Reuters bogus Party-ID and vote shares agree with the rating.

The Civiqs poll (36% approval) makes sense. It agrees with the 34.8% calculation using NEP weights.

Biden approval 1CNNApproveDisapprove
Democrat36%64%36%
Republican28%8%92%
Independent36%25%75%
CALCULATED100%34%66%
Biden Approval 2NEPApproveDisapprove
Democrat36%64%36%
Republican36%8%92%
Independent28%25%75%
CALCULATED100%33%67%

Sensitivity Analysis – Biden total approval for 15 scenarios: 60,64,68% Democratic approval, 19,23,27% Independent and 8% Republican

Republican 8%
Democrat
Independent60%64%68%
27%32.0%33.5%34.9%
25%31.5%32.9%34.4%
23%30.9%32.4%33.8%
21%30.4%31.8%33.2%
19%29.8%31.2%32.7%
ReutersParty-IDApproveDisapprove
Democrat45.7%81%19%
Republican40.6%17%83%
Independent13.7%39%61%
Calculated100%49.3%50.7%
Actual48%46%

Real Clear Politics Biden approval trend: https://www.realclearpolitics.com/epolls/other/president-biden-job-approval-7320.html

CNN Poll: https://www.cnn.com/2021/12/15/politics/cnn-poll-economy/index.html https://www.documentcloud.org/documents/21154775-rel8a-biden-economy?responsive=1&title=1

CiviqsNEP Party IDApproveDisapproveNo opinion
Democrat36%76%10%14%
Republican36%2%96%2%
Independent28%24%55%21%
CALCULATED100%34.8%53.6%11.6%
Actual36%55%9%
 
Leave a comment

Posted by on December 17, 2021 in Uncategorized


The 2020 election math anomaly that proves fraud

Richard Charnin Dec. 2, 2021

The single 2020 election anomaly that proves fraud.

In Georgia, 96,800 ballots were cast for just the president and no other office on the ballot. A total of 96,000 voted just for Biden and 800 just for Trump. What is the probability of such a wide difference? We would expect approximately 48,000 for each. It is just as likely for a Biden voter to do this as it is for a Trump voter.

In Georgia, Biden won 99% of ballots that only voted for President and no other races.
The number of votes: Trump: 818; Biden: 95,801.

Calc 1: binomial distribution function:
P = BINOMDIST(8,968,0.5,true)
P = 7.51E-273 (0)

Calc 2: factorial function (!):
For example, 8! = 8*7*6*5*4*3*2*1.
P = 968!/(8!*960!)*(0.5^8)*(0.5^960)
P = (0.5^8)*(0.5^960)
P = 0.5^968
P= 4.01E-292 =0

This is absolute proof of massive election fraud!

https://publicinterestlegal.org/wp-content/uploads/2021/09/Mail-Voting-2012_2020-1P-GA.pdf?fbclid=IwAR1hxnNLzIFMVjmz-SCoAs7k22XGy21t_HB2WNj3RyXod0i78BfNG3Y23Zg

 
Leave a comment

Posted by on December 2, 2021 in Uncategorized


Wisconsin 2020 election fraud: 82,766 mail ballots missing or undeliverable

Richard Charnin Dec. 1, 2021

LINKS TO  BLOG POSTS

The Public Interest Legal Foundation (PILF) said on Friday that 82,766 mail ballots sent to voters in Wisconsin’s November 2020 presidential election “went missing or undeliverable,” a number more than four times greater than Joe Biden’s 20,682 vote certified margin of victory in the state.

The report showed that, unlike the results of the 2012 and 2016 elections, the number of “missing or undeliverable” mail ballots in 2020 exceeded the margin of victory for the state’s ten electoral college votes.

In 2016, 158,846 ballots were mailed to Wisconsin voters, just 11 percent of the 1.4 million votes cast in that election. Of these ballots, 11,138 were classified as “unknown” and 1,846 were “undeliverable.” Combining the two classifications, the 12,984 mail ballots were only 47 percent of Donald Trump’s certified 27,257 vote margin of victory in WI over Hillary Clinton.

In 2020, 1.4 million ballots were mailed to Wisconsin voters (86 percent of the 1.6 million mail in votes cast). Nationwide, of 90.6 million ballots sent, 1.1 million were undeliverable, 560,814 rejected and 14.7 million “unknown”.

PILF President J. Christian Adams: “These figures detail how the 2020 push to mail voting needs to be a one-year experiment. Bills like H.R. 1/S.1 risk inflating these numbers even further, pushing our election system toward error, disenfranchisement and ultimately widespread doubt about election outcomes. Some of the counties with the least experience in administering mail voting rejected the most ballots nationwide. If continued, 2020-style chaos will become the norm”.

Biden “won” Wisconsin by 20,682 votes, but Trump led by 127,000 votes (52.4-47.6%) with just 701,000 (18%) of 3.3 million remaining to be counted. The probability that Biden would tie Trump by winning 59.1% of the remaining votes when he had just 47.6% of the votes counted is

P= 1 in 15,421 (assuming a 1.0% MoE): P=normdist(E30,0.5,0.01/1.96, false)

https://publicinterestlegal.org/wp-content/uploads/2021/08/Mail-Voting-2012_2020-1P-WI.pdf

 
Leave a comment

Posted by on December 1, 2021 in Uncategorized


MishTalk

Global Economic Trend Analysis